Phenotype List
This section provides a description of the Phenotype List, where identified phenotypes can be managed and reviewed. The list shows the identified cell populations color coded by phenotype. It serves as a central repository for all phenotypic data. The Phenotype list offers an overview of the selected Variables and their co-occurrences. It also displays the Cell count of the individual phenotypes and their co-occurrences. Visibility can be toggled by clicking on the eye next to the Cell count.
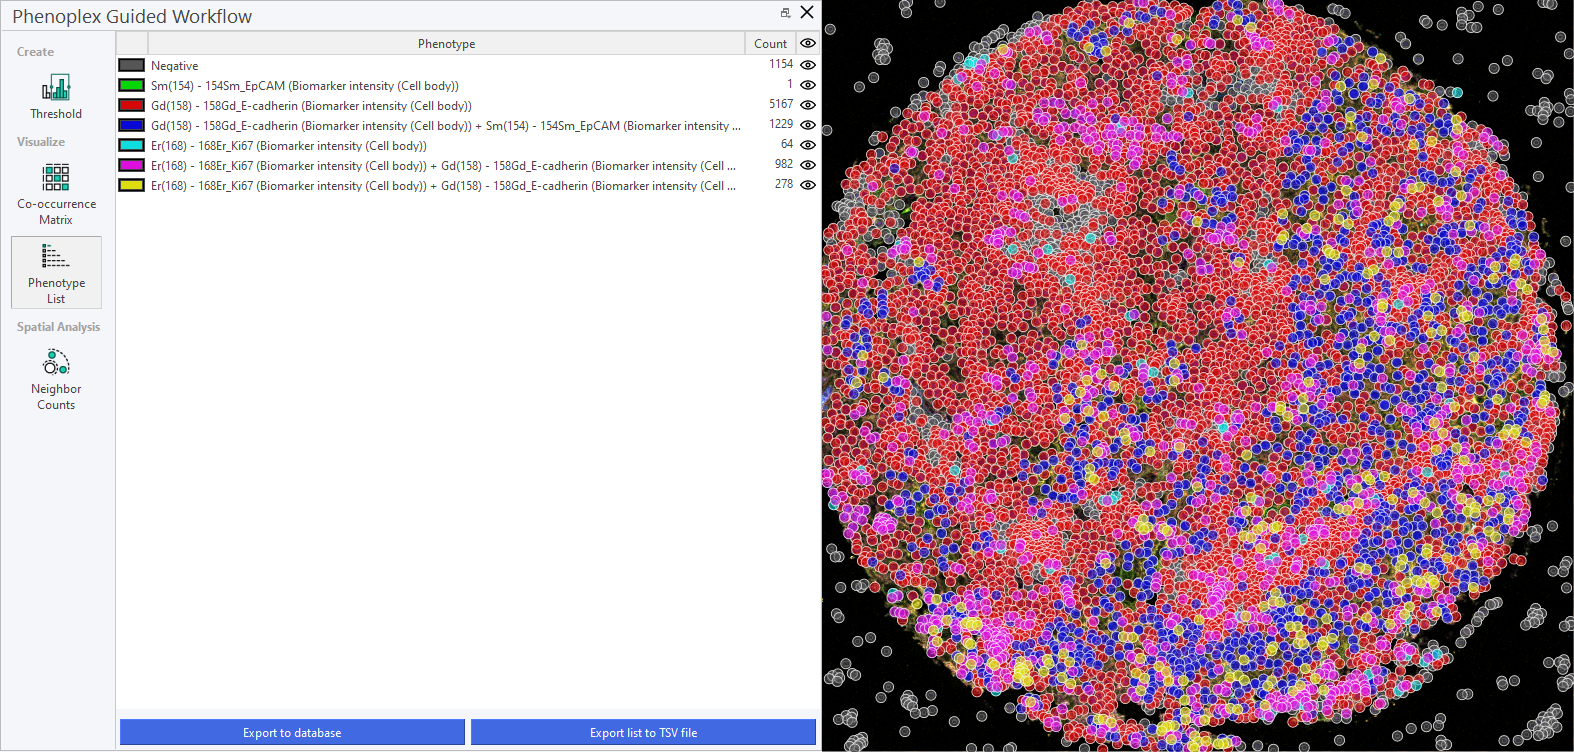
For easier inspection, it is often convenient to hide the negative cells, along with the phenotypes not undergoing current inspection, by clicking on the Eye icon. Each phenotype is named by its positive biomarkers; they are negative for all others. In the example below, all phenotypes except three are hidden. This makes it easier to see the spatial distribution of these three phenotypes, as they are highlighted with different colors in the image.
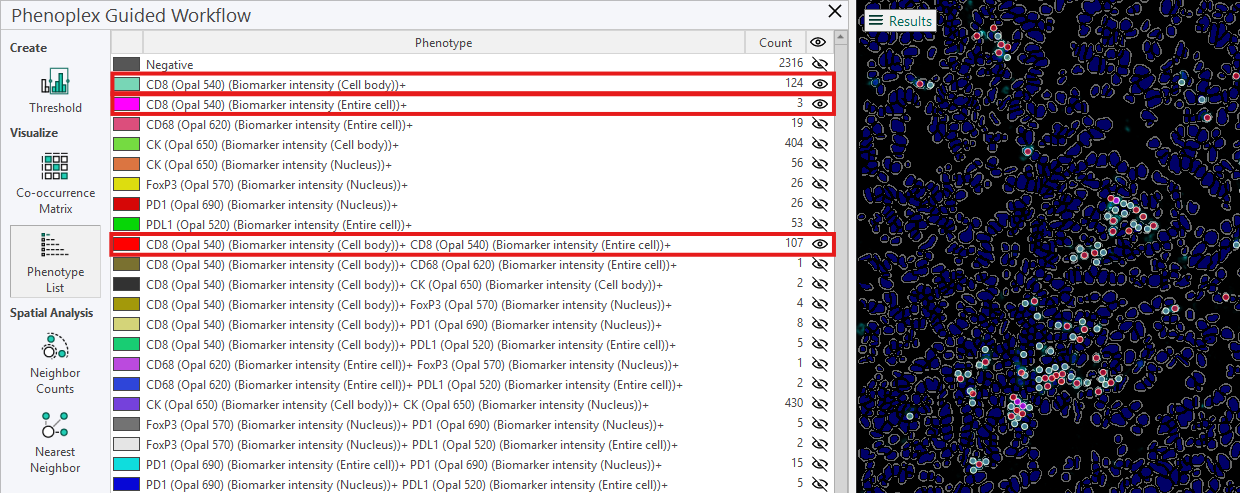
From the phenotype list in the example, the following information is available for the three phenotypes:
-
For the phenotype CD8 (Opal 540) (Cell Body)+, the count is 124, meaning that 124 cells are positive only for this biomarker.
-
For the phenotype CD8 (Opal 540) (Entire Cell)+, the count is 3, meaning 3 cells are positive only for this biomarker.
-
For the phenotype CD8 (Opal 540) (Cell Body)+ CD8 (Opal 540) (Entire Cell)+, the count is 107, meaning that 107 cells are positive for both these biomarkers.
Phenotype Naming and Sorting
This feature introduces a standardized, alphanumeric naming and sorting system for phenotype classification, ensuring that biomarker combinations are displayed in a logical and consistent order. This update simplifies phenotype identification and improves readability, particularly in complex tasks involving multiple biomarkers.
Alphanumeric Naming
Phenotype names are generated by concatenating biomarker names in a strict alphanumeric order, regardless of the functional category or biological significance of each marker. For instance, a phenotype containing CD3, CD8, CD40, and PD-L1 will always be displayed as CD3+ CD8+ CD40+ PD-L1+, rather than reflecting the order in which biomarkers were labeled.
Layered Sorting
Negative Phenotypes: If applicable, these are displayed first in the phenotype list. Single Positives: Phenotypes with single positive markers are listed next, sorted alphanumerically. Double Positives, Triple Positives, etc.: As the complexity of the phenotype increases, phenotypes are sorted in ascending alphanumeric order within each group.
Having a high number of objects that are Triple Positives or more is often biologically unlikely and is often a sign that the Threshold for the different biomarkers needs adjusting.
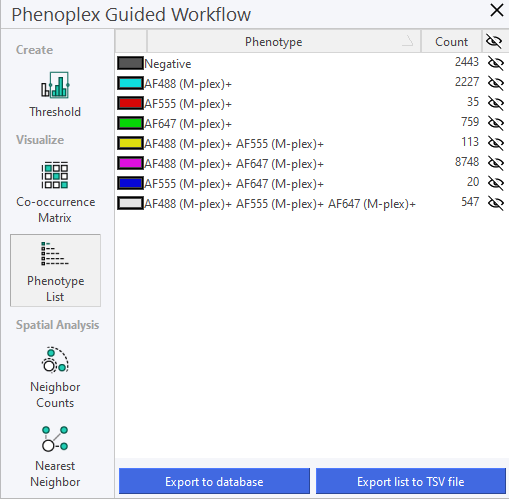
Export phenotypes to Database
Clicking Export to Database exports/saves the phenotype list to the database. The data from the phenotype list will then be available under Phenotype in the database.

When changes are made to the Phenotype List and saved to the database, any previously saved Phenotype List for that image will be overwritten.
Export to TSV file
Clicking on Export list to TSV file will export the Phenotype List as a .tsv file to any specified folder. The TSV file can then be opened and used in other programs; for instance, the phenotype list can be opened and inspected in Excel, or it can be used in the Explore Q/C tool to explore and uncover differences between cohorts.
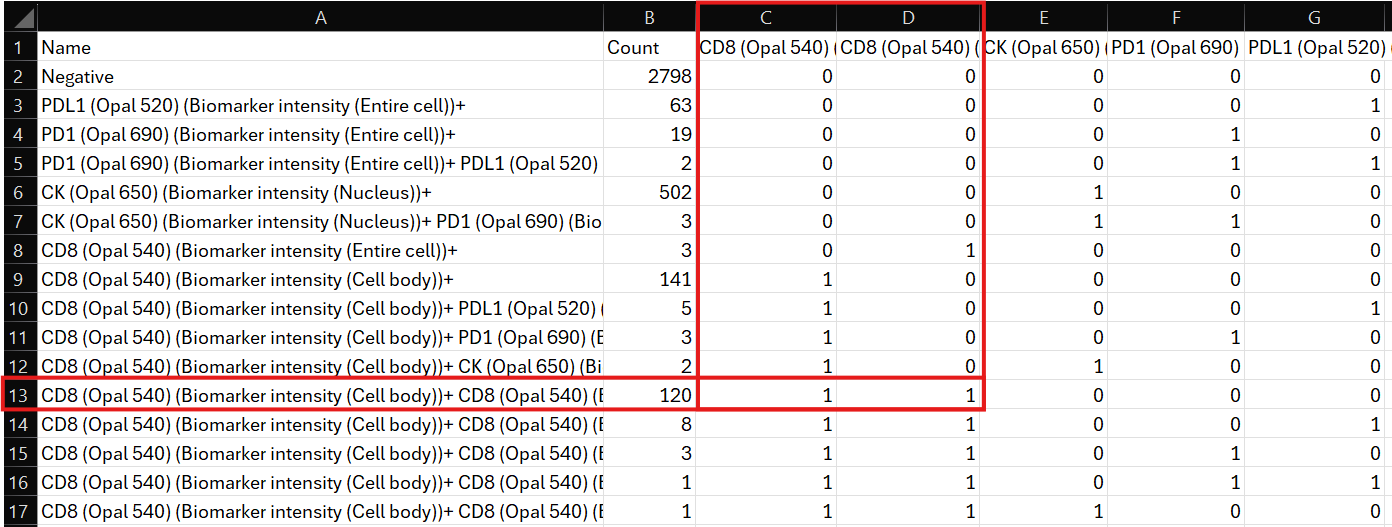
When exporting the Phenotype List to a TSV file, the sorting of the list might change from how it is displayed in Visiopharm.