Co-occurrence Matrix
In this section, we will explore the Co-occurrence Matrix, which helps in understanding the spatial relationships between different phenotypes. This matrix is essential for analyzing how phenotypes are distributed in relation to each other within the sample.
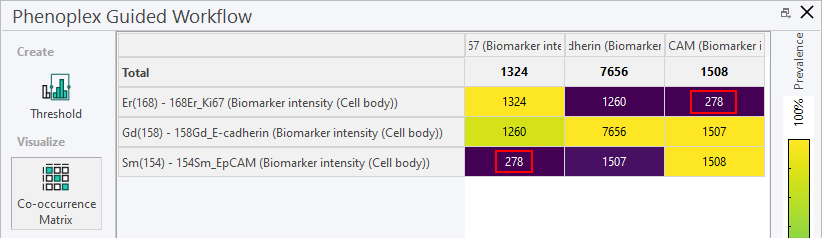
A way to analyze the postivity settings is to view the Co-occurence Matrix which provides an overview of the selected variables, and where they occur in which numbers. The numbers in the matrix are the total number of cells positive for that combination on all the images loaded into the workflow.
Make sure to select the variables and check the Use for phenotyping box in the Threshold menu before proceeding to the Co-occurrence Matrix.
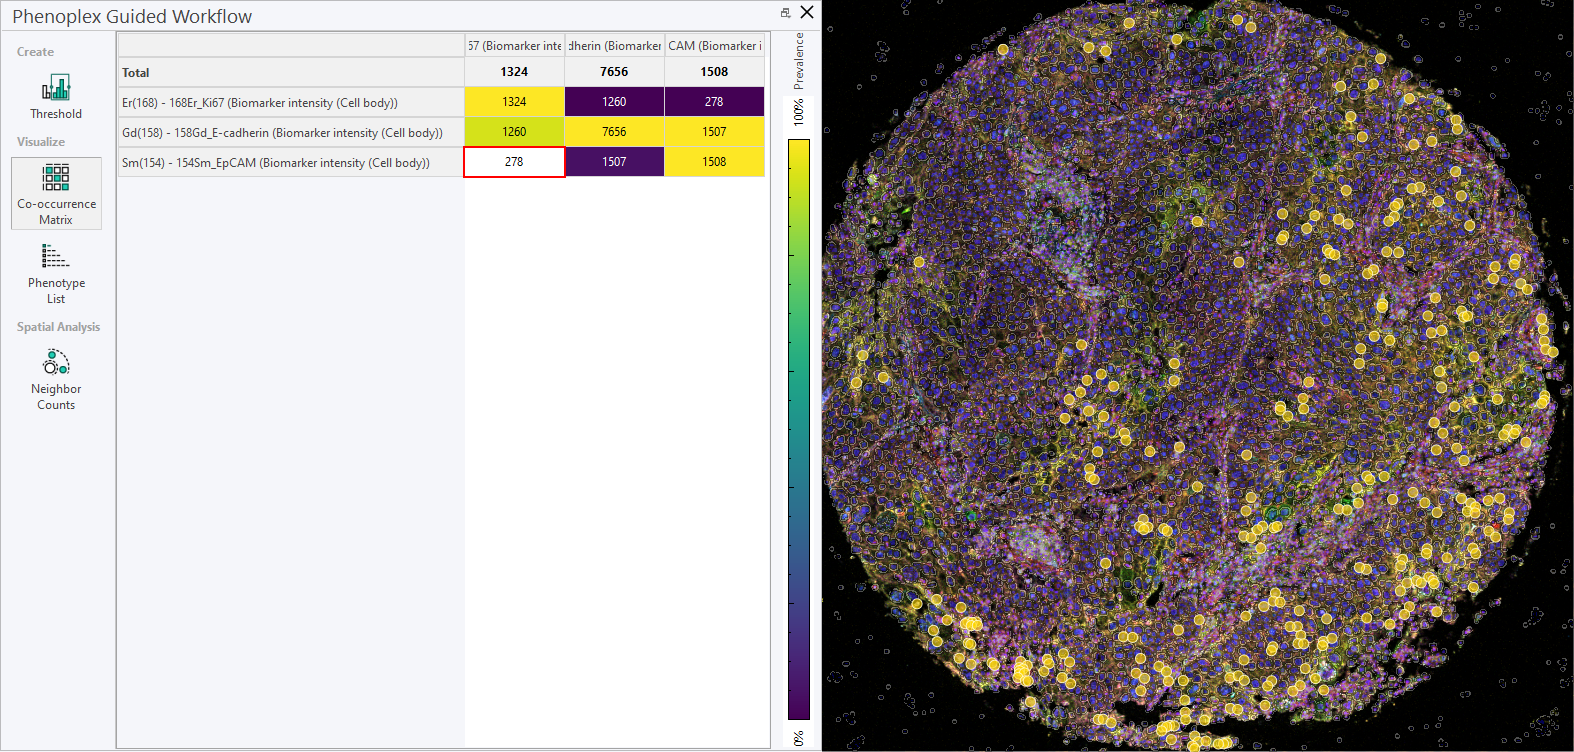
Clicking on one of the co-occurrence numbers will show where they are on the current image. Clicking in the same field again hides the yellow positivity marker dots in the viewer.
Data from the co-occurrence matrix can be copied into Excel using the standard shortcuts Ctrl+C and Ctrl+V.