Deep learning
Deep learning and convolutional neural networks are a broader family of AI machine learning methods. It involves neural network algorithms that use a cascade of many layers of nonlinear processing units for feature extraction and transformation with each successive layer using the output from the previous layer as input. Using deep learning for classification allows you to segment abstract image structures that would be impossible to segment with a simple pixel classifier.
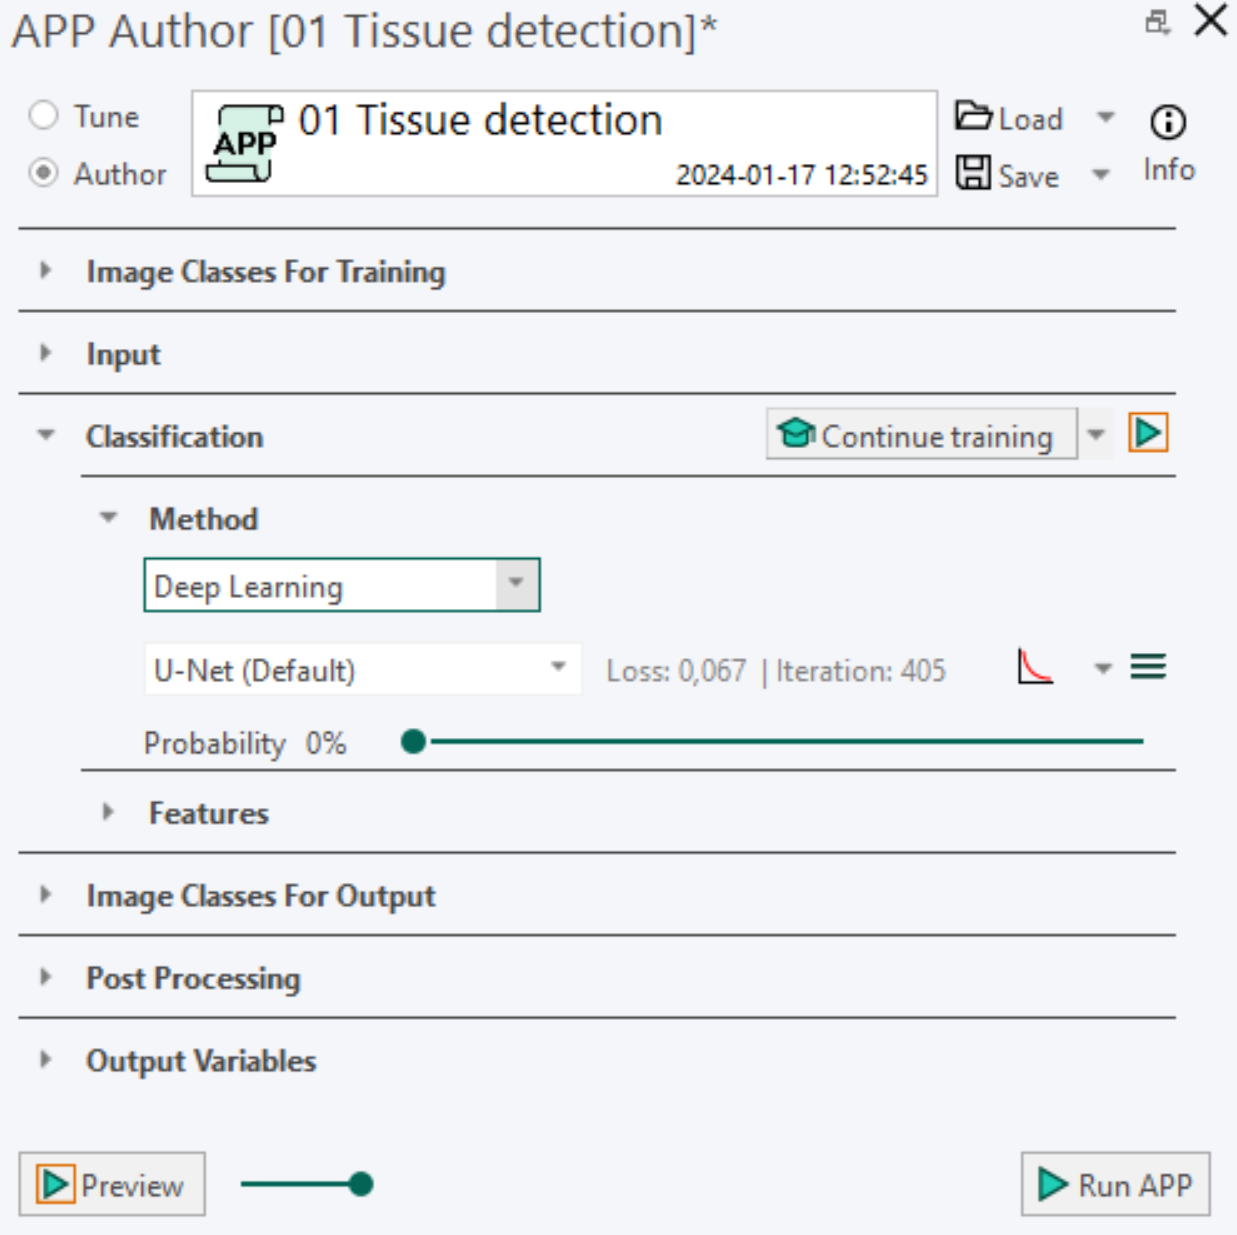
Network Architecture U-Net (Default), DeepLabv3+ (Requires GPU) and FCN-8s are three different network architectures. We generally recommend choosing U-Net over FCN-8s and DeepLabv3+, which is emphasized by the (Default) tag.
Convergence Curve is a simple training plot showing the learning performance of the neural network. The x-axis shows the number of iterations, while the y-axis shows the training loss or error rate depending on the settings. The settings are found in the dropdown menu of the training plot icon  .
.
Loss is a measure used determine the performance of the network optimization algorithm to a scalar value by measuring the inconsistency between predicted and actual values. The robustness of the model increases with the decrease of training loss. When the training is paused or stopped, the final loss value is shown. The training loss is available from the dropdown menu next to the training plot icon . When selected, the loss of the network is visualized in the training plot and next to the network architecture.
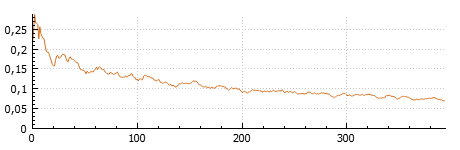
Metric is a measure used to evaluate the network algorithm. The performance metric used is the error rate. The error rate percentage fluctuates and decreases during training until the model has converged. When the training is paused or stopped, the final error rate percentage is shown. The training metric is available from the dropdown menu next to the training plot icon . When selected, the error rate of the network is visualized in the training plot and next to the network architecture.
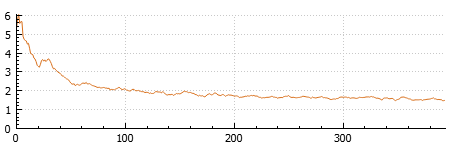
Iterations are the number of times a batch of data has passed through the network algorithm. The number of iterations are visualized in the training plot and next to the training loss or error rate.
Probability value is determined by the slider position indicates the minimum probability needed in order to classify a pixel as one of the image classes. The deep learning classifier will classify a pixel to the class having the highest probability, given that it is above this minimum value. As an example, consider a pixel having a probability of 40% for belonging to class A, 35% for class B and 25% for class C. If the minimum probability value is set to 50%, the pixel will not be classified as any of the classes. On the contrary, if a value below 40% is chosen, the pixel will be classified as class A. The default probability is 0% meaning that all pixels will be classified and given a label.
Advanced Deep learning settings By pressing the menu button  of the APP author, the AI Architect dialog appears for advanced deep learning settings.
Tensorboard is an open-source tool from Google, and we send information about training progress from your Visiopharm installation to Tensorboard. Tensorboard options are available from the dropdown menu next to the training plot icon .
Select Inputs dialog
Select Inputs dialog
This dialog is opened when certain APPs are launched, where some color bands have yet to be defined, as indicited in the message: "APP cannot run because the image's color setup is different from what the APP expects."
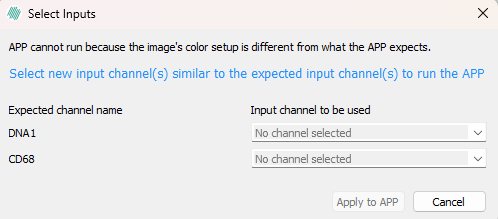
To resolve this, simply select bands in the image from the dropdown menu that correspond to the Expected channel names, eg for DNA1 select the band in the image that contains this biomarker.