Histogram
Using a histogram to present the data is useful when examining a single variable, and is typically better than a boxplot when you need to visualize the detailed distribution and frequency of data values, especially in cases with a large dataset or when you want to observe data patterns within specific intervals or bins.
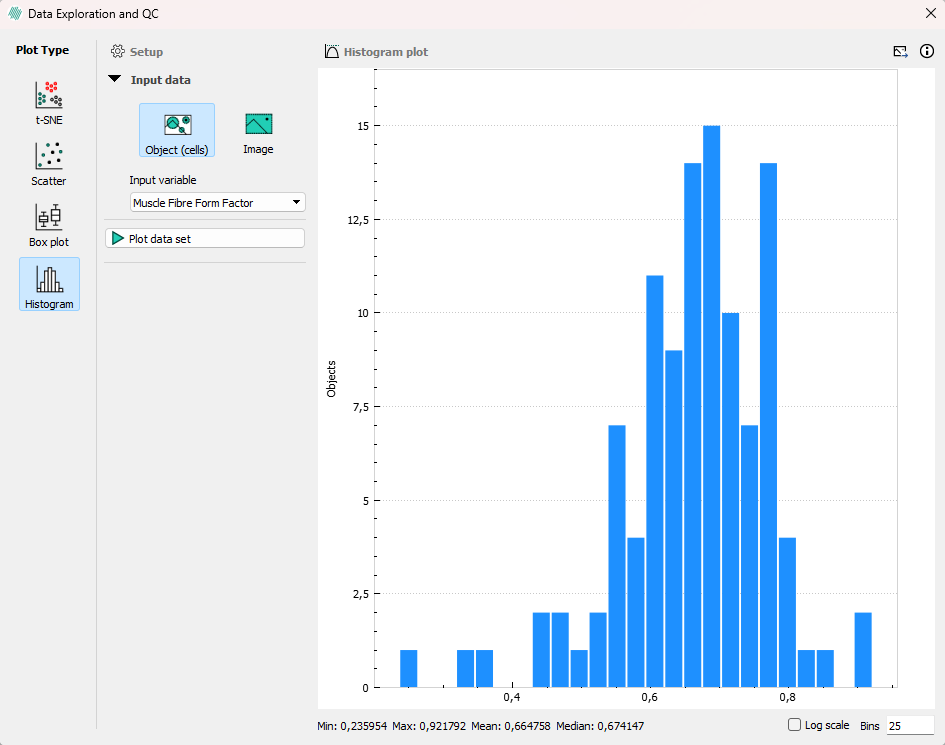
When depicting data using the histogram both the number of bins can be changed (default 256) and whether or not the number of objects should be measured on a logaritmic scale. The values for Minimum, Maximum, Mean, and Median are not impacted by changing either setting.