Histogram
A histogram is useful for presenting data when examining a single variable. It is typically more effective than a boxplot for visualizing the detailed distribution and frequency of data values, especially with large datasets or when observing data patterns within specific intervals or bins.
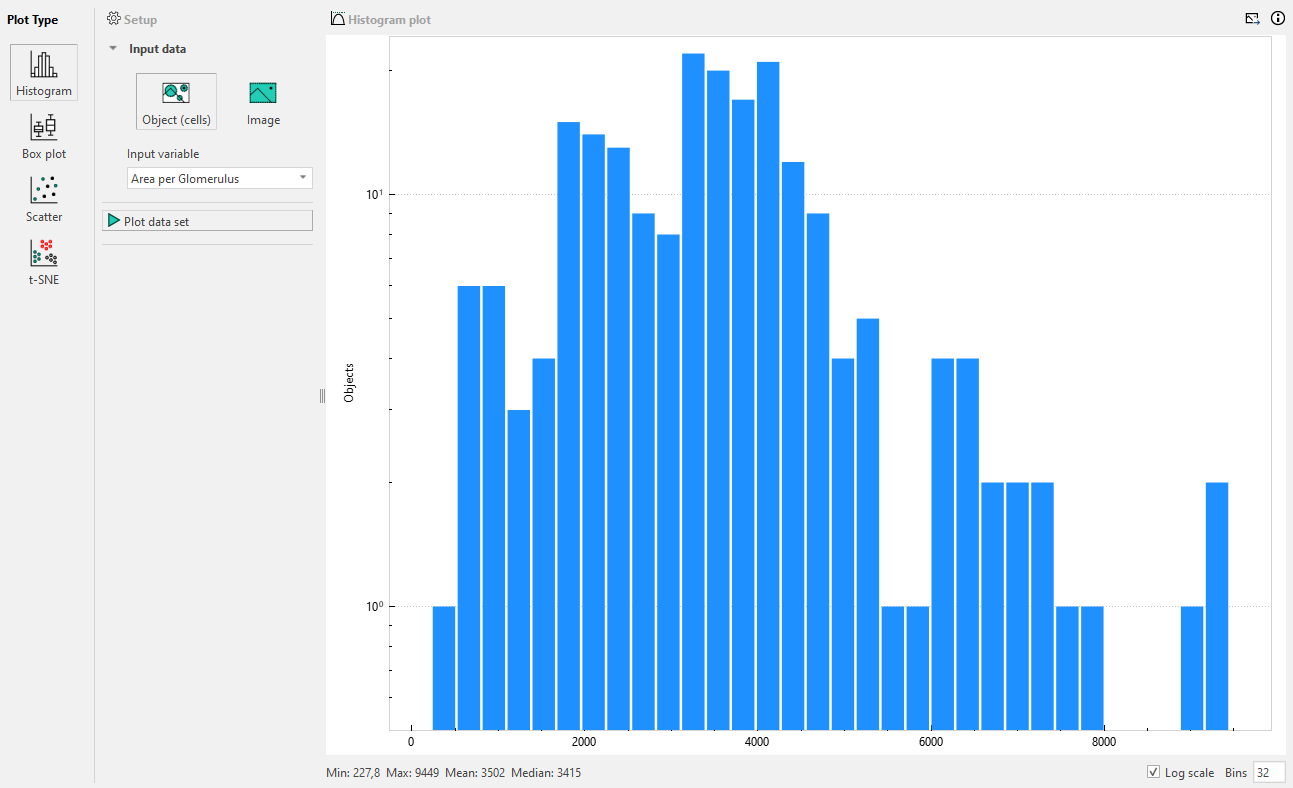
When depicting data using the histogram both the number of bins can be changed (default 256) and whether or not the number of objects should be measured on a logaritmic scale. The values for Minimum, Maximum, Mean, and Median are not impacted by changing either setting.