Neighbor Counts
The Neighborhood count feature is used for neighborhood analysis. In Neighbor Counts you are able to quantify the number of neighboring cells for each phenotype. This feature is available in version 2024.06 Beta and newer, and it is helpful in understanding cell-to-cell interactions within the tissue.
The analysis of the neighborhood is a quantification of biomarker positive neighbor objects around a user defined target cell within a radius (µm) of a target object.
This enables users to specify Targets as the center points for the analysis as well as neighboring objects. Targets and neighbors are defined in the Threshold Step in the Phenoplex Guided Workflow. Multiple Thresholds can be combined to add up to a specific phenotype. Say for example; CD3 CD4 CD45 are defined as specific T helper cells in the images. Only objects that are positive for all three biomarkers CD3, CD4 and CD45 will be selected and counted for the neighborhood analysis.
Threshold results must have been saved in the database in order to be able to perform a neighborhood analysis.
Neighborhood Analysis
New Target
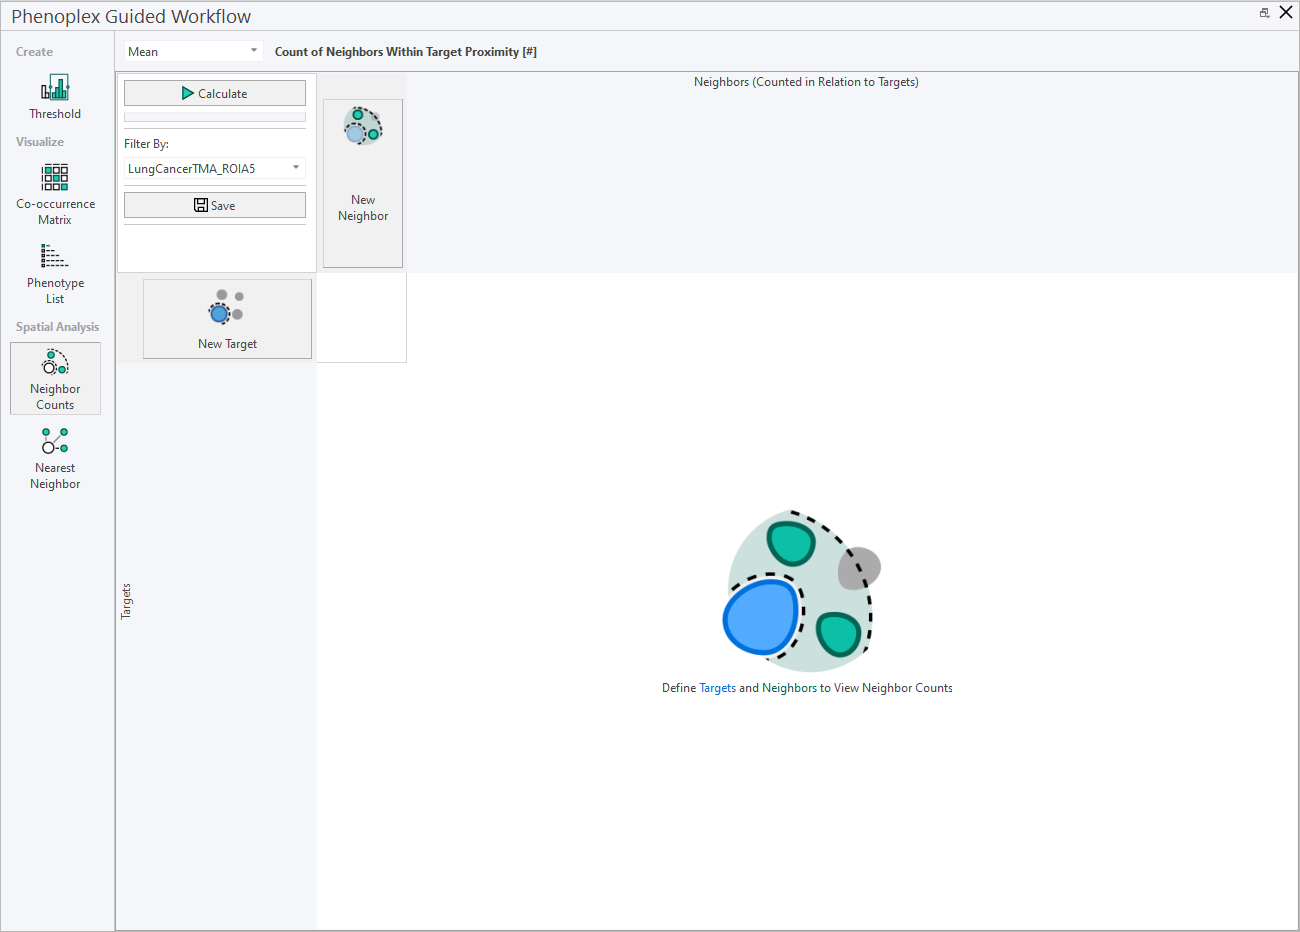
- Start by clicking Neighbor Counts in the left vertical menu of the Phenoplex Guided Workflow menu. The options New Target and New Neighbor lets you add targets and neighbors which you can use to start populating the neighborhood matrix table.
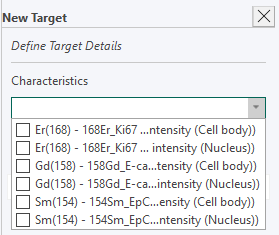
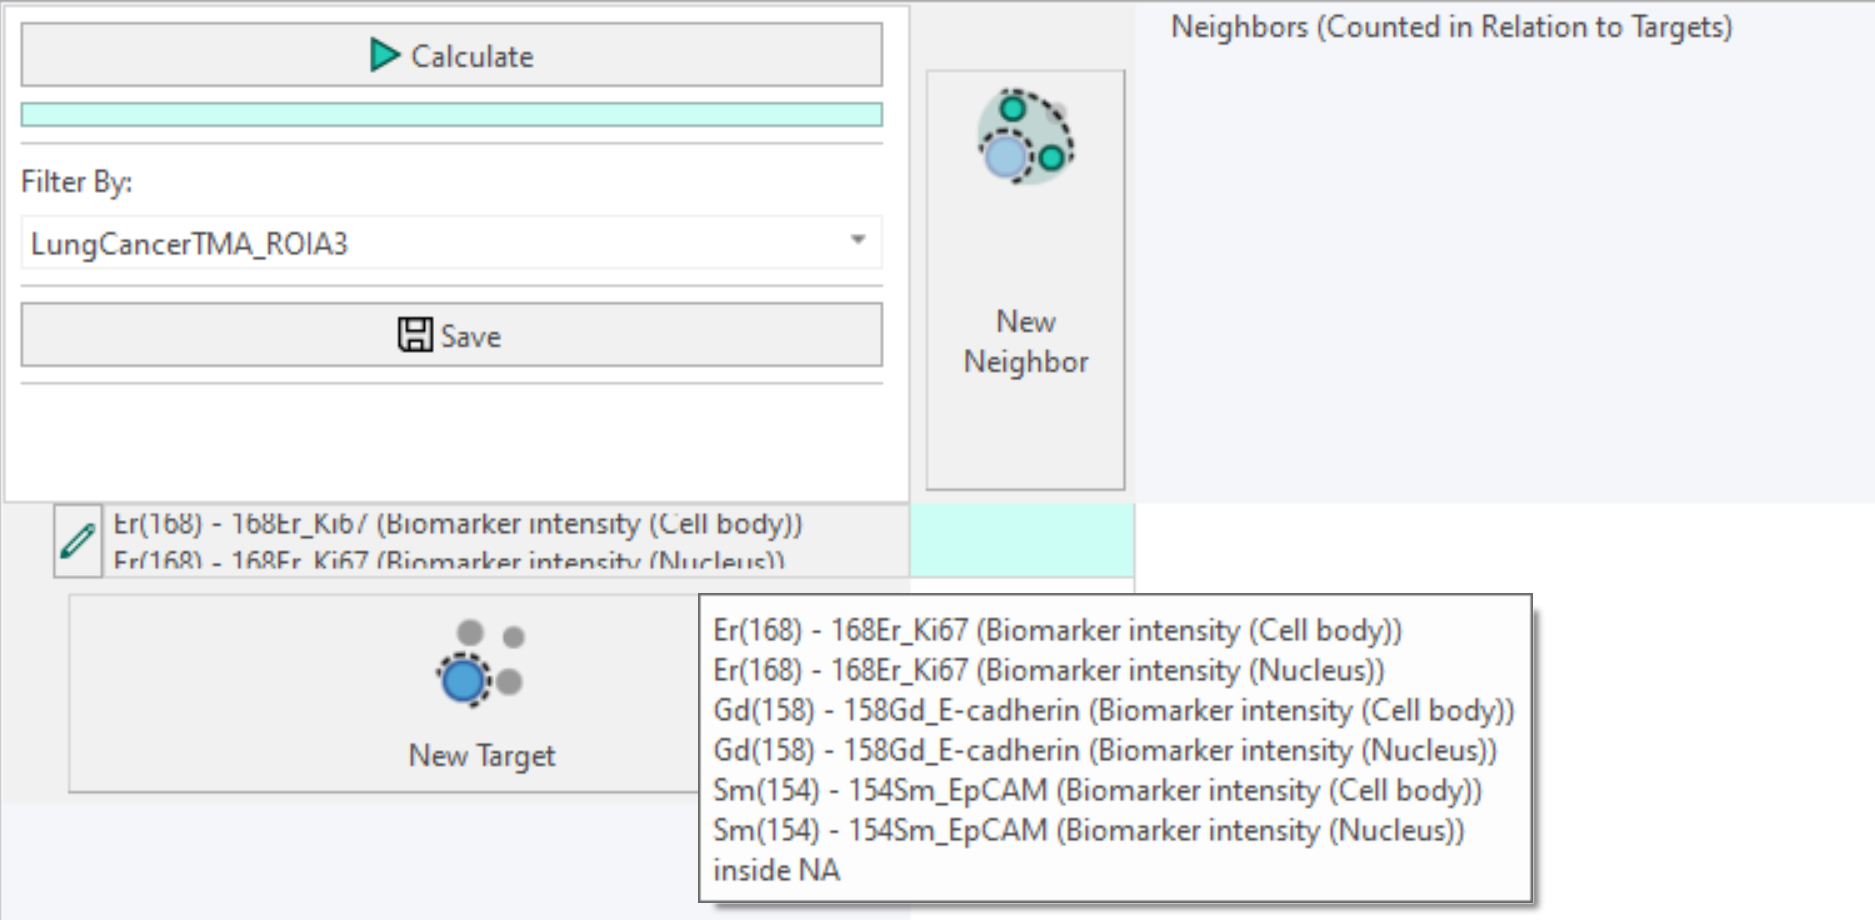
- Click New Target. Choose Characteristics of the Target by clicking on the drop-down menu underneath
- Select the biomarkers for the Target:
- Specify the ROI in which the target and their neighbor(s) should be quantified.
This feature only works if you have previously defined ROI(s) in the image, either done manually or using an APP.
- Click Done to add the target as a new Row entry to the Neighborhood Table.
New Neighbor
- To open the neighborhood definition menu, click on New Neighbor.
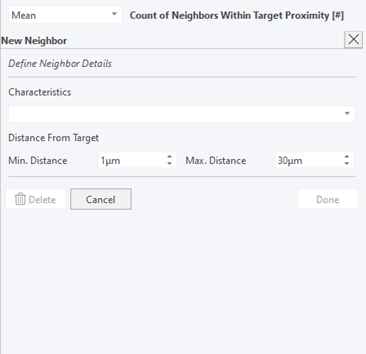
- Define the characteristics of the Neighbor by clicking on the drop-down menu underneath.
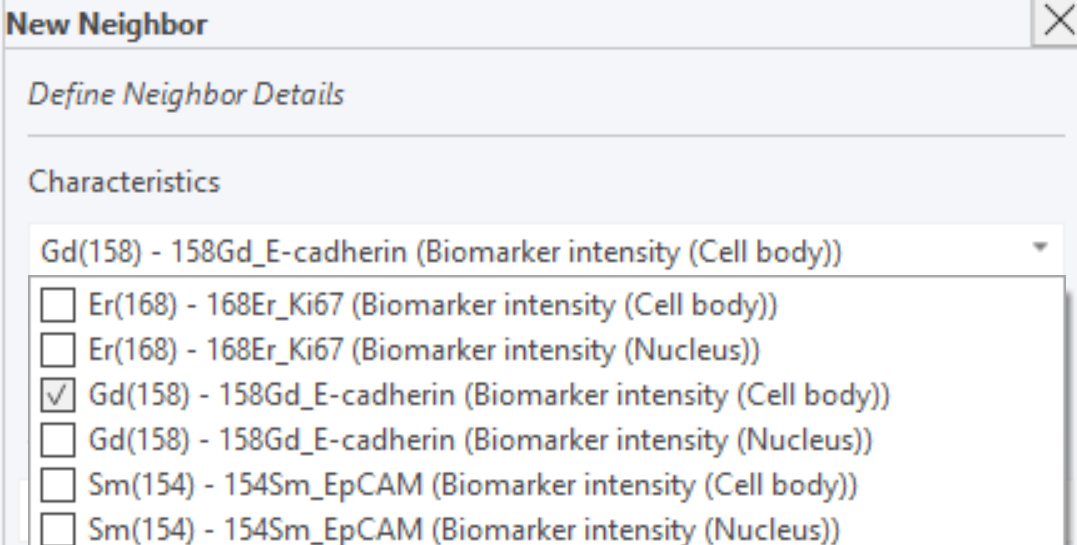
- Define the Radius around the Target(s) in which the Neighbor should be quantified. This is done by clicking in the Min. Distance and Max. Distance Field to update the radius band.
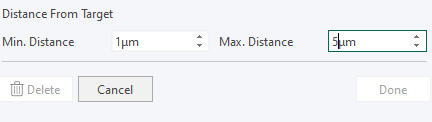
- Click Done to add the target as a new column entry to the neighborhood table.
Calculate Neighbor Counts
When you have completed the analysis of all necessary neighbors and targets, click Calculate. The progress bar below the Calculate button indicates that the process is still running if not filled from left to right.
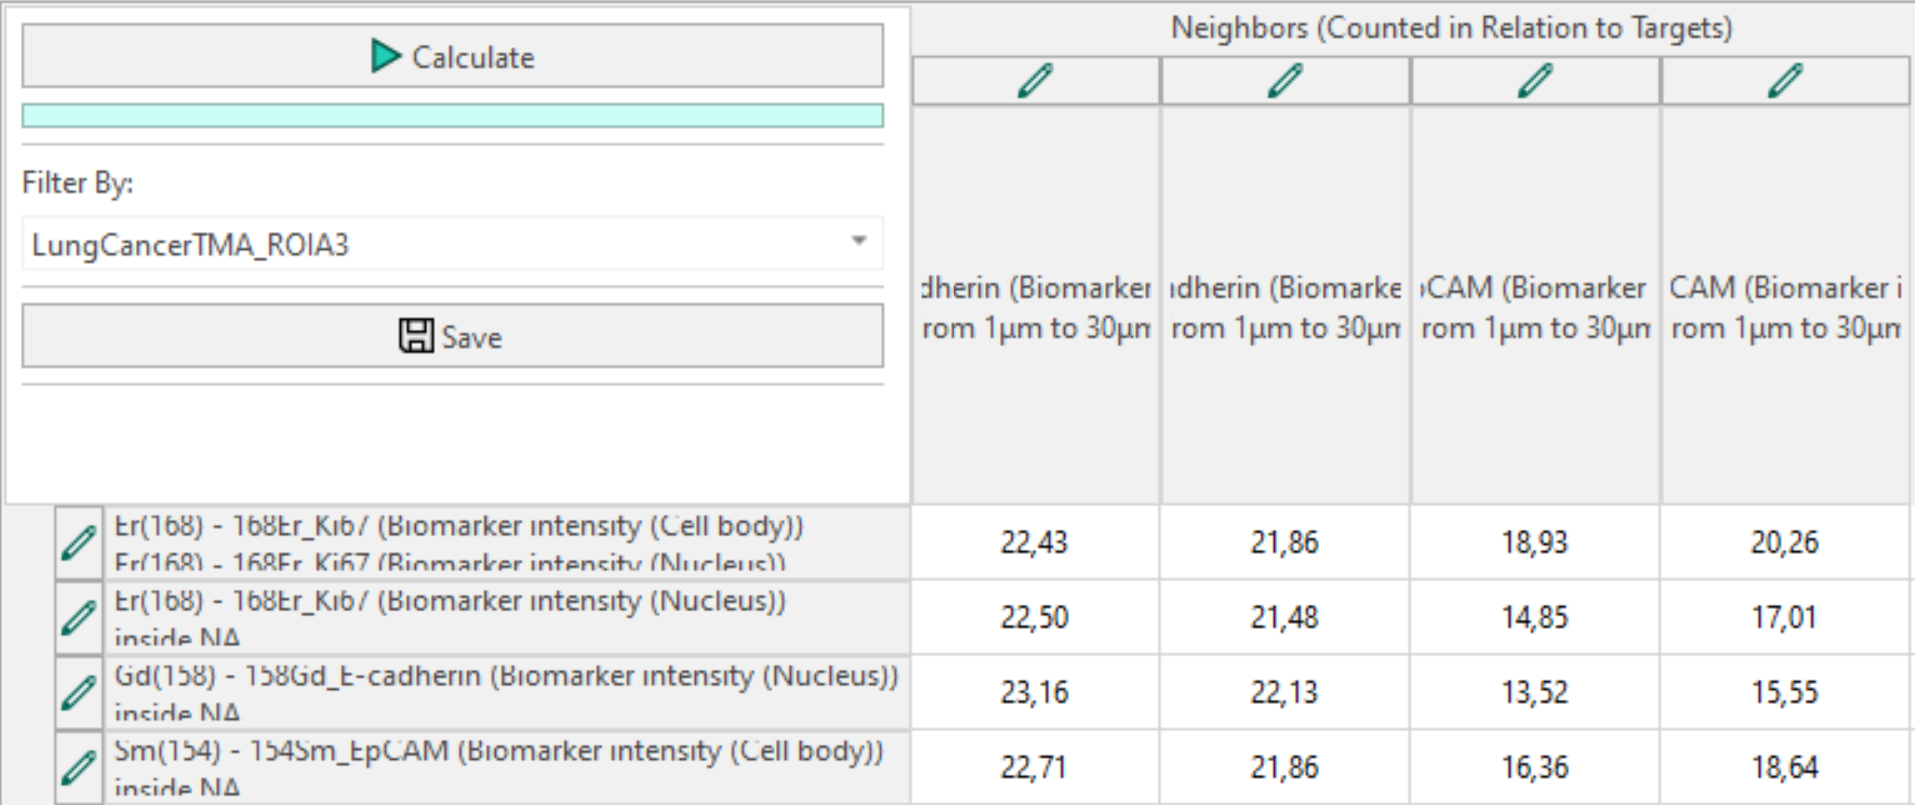
Filter By Neighbor Counts
You can switch to other image results in the Filter by menu.
When you switch to another image, the table is updated with the results from the newly selected image.
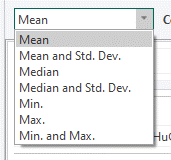
To change to different statistical values in the table, use the drop-down menu.
Save Neighbor Counts
The Save button saves the selection of Targets and Neighbors including distance and ROI selection as a preset to the Database.
Highlighting Neighbors
Perform a double click to highlight a specific cell and see all of its target objects and neighbors within the defined radius.
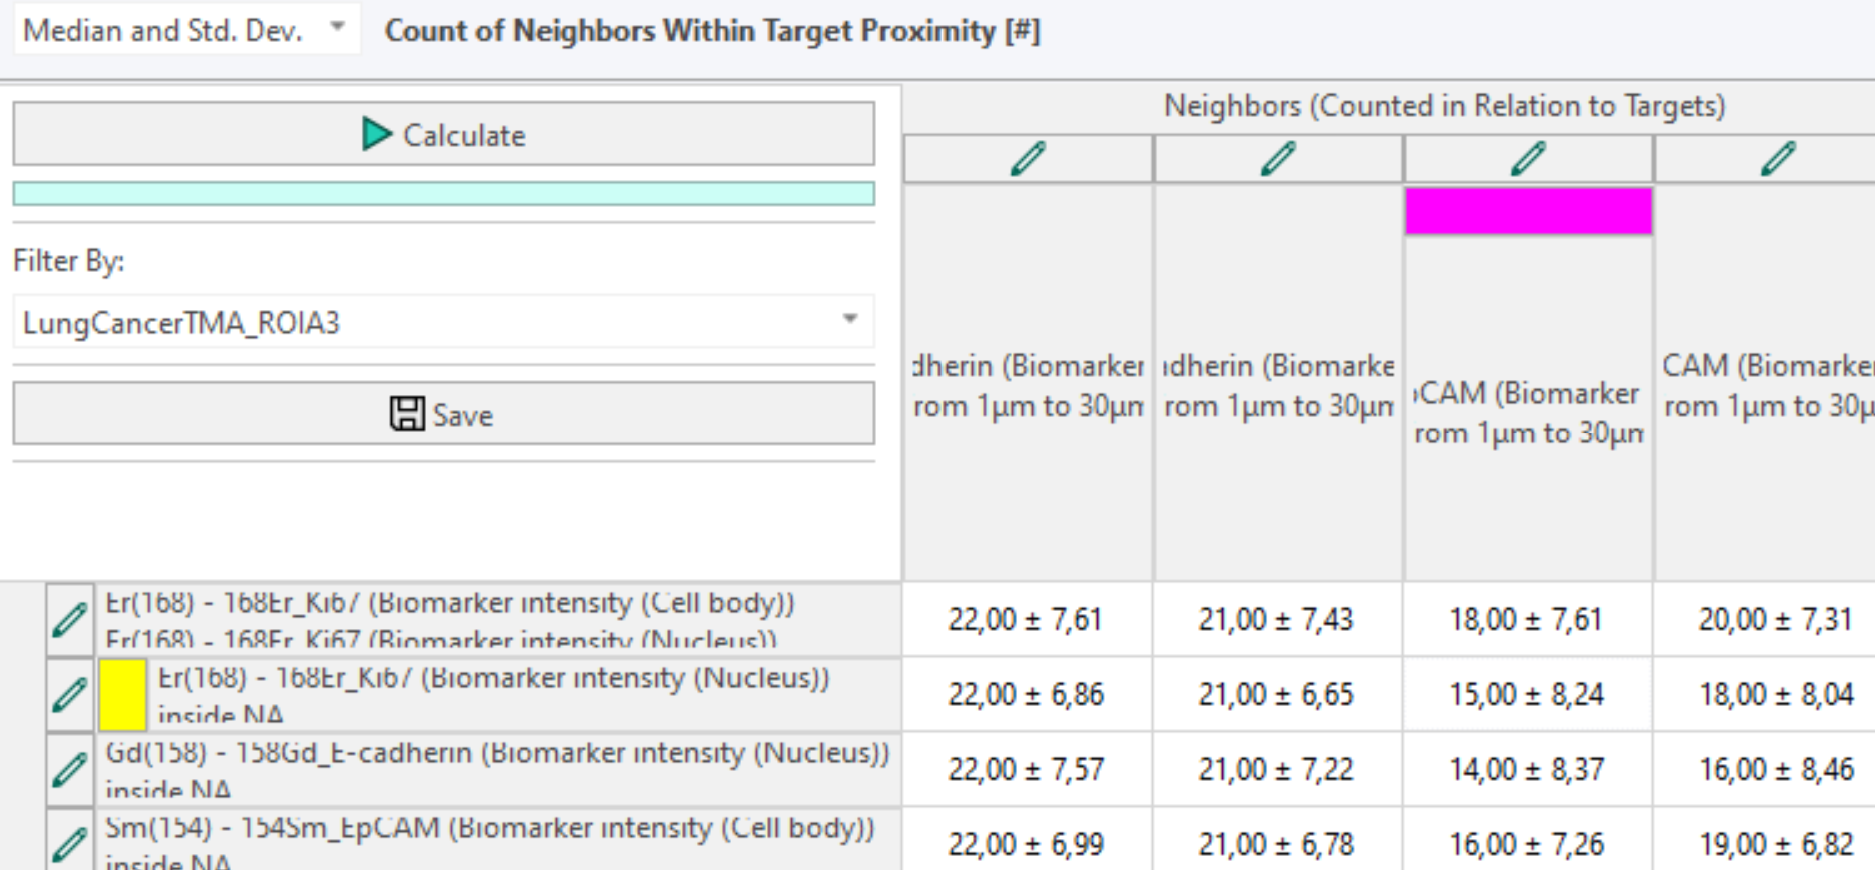
Change Colors in Neighbor Counts
Clicking on the yellow and magenta color field opens a color picker to update colors as needed by the user:
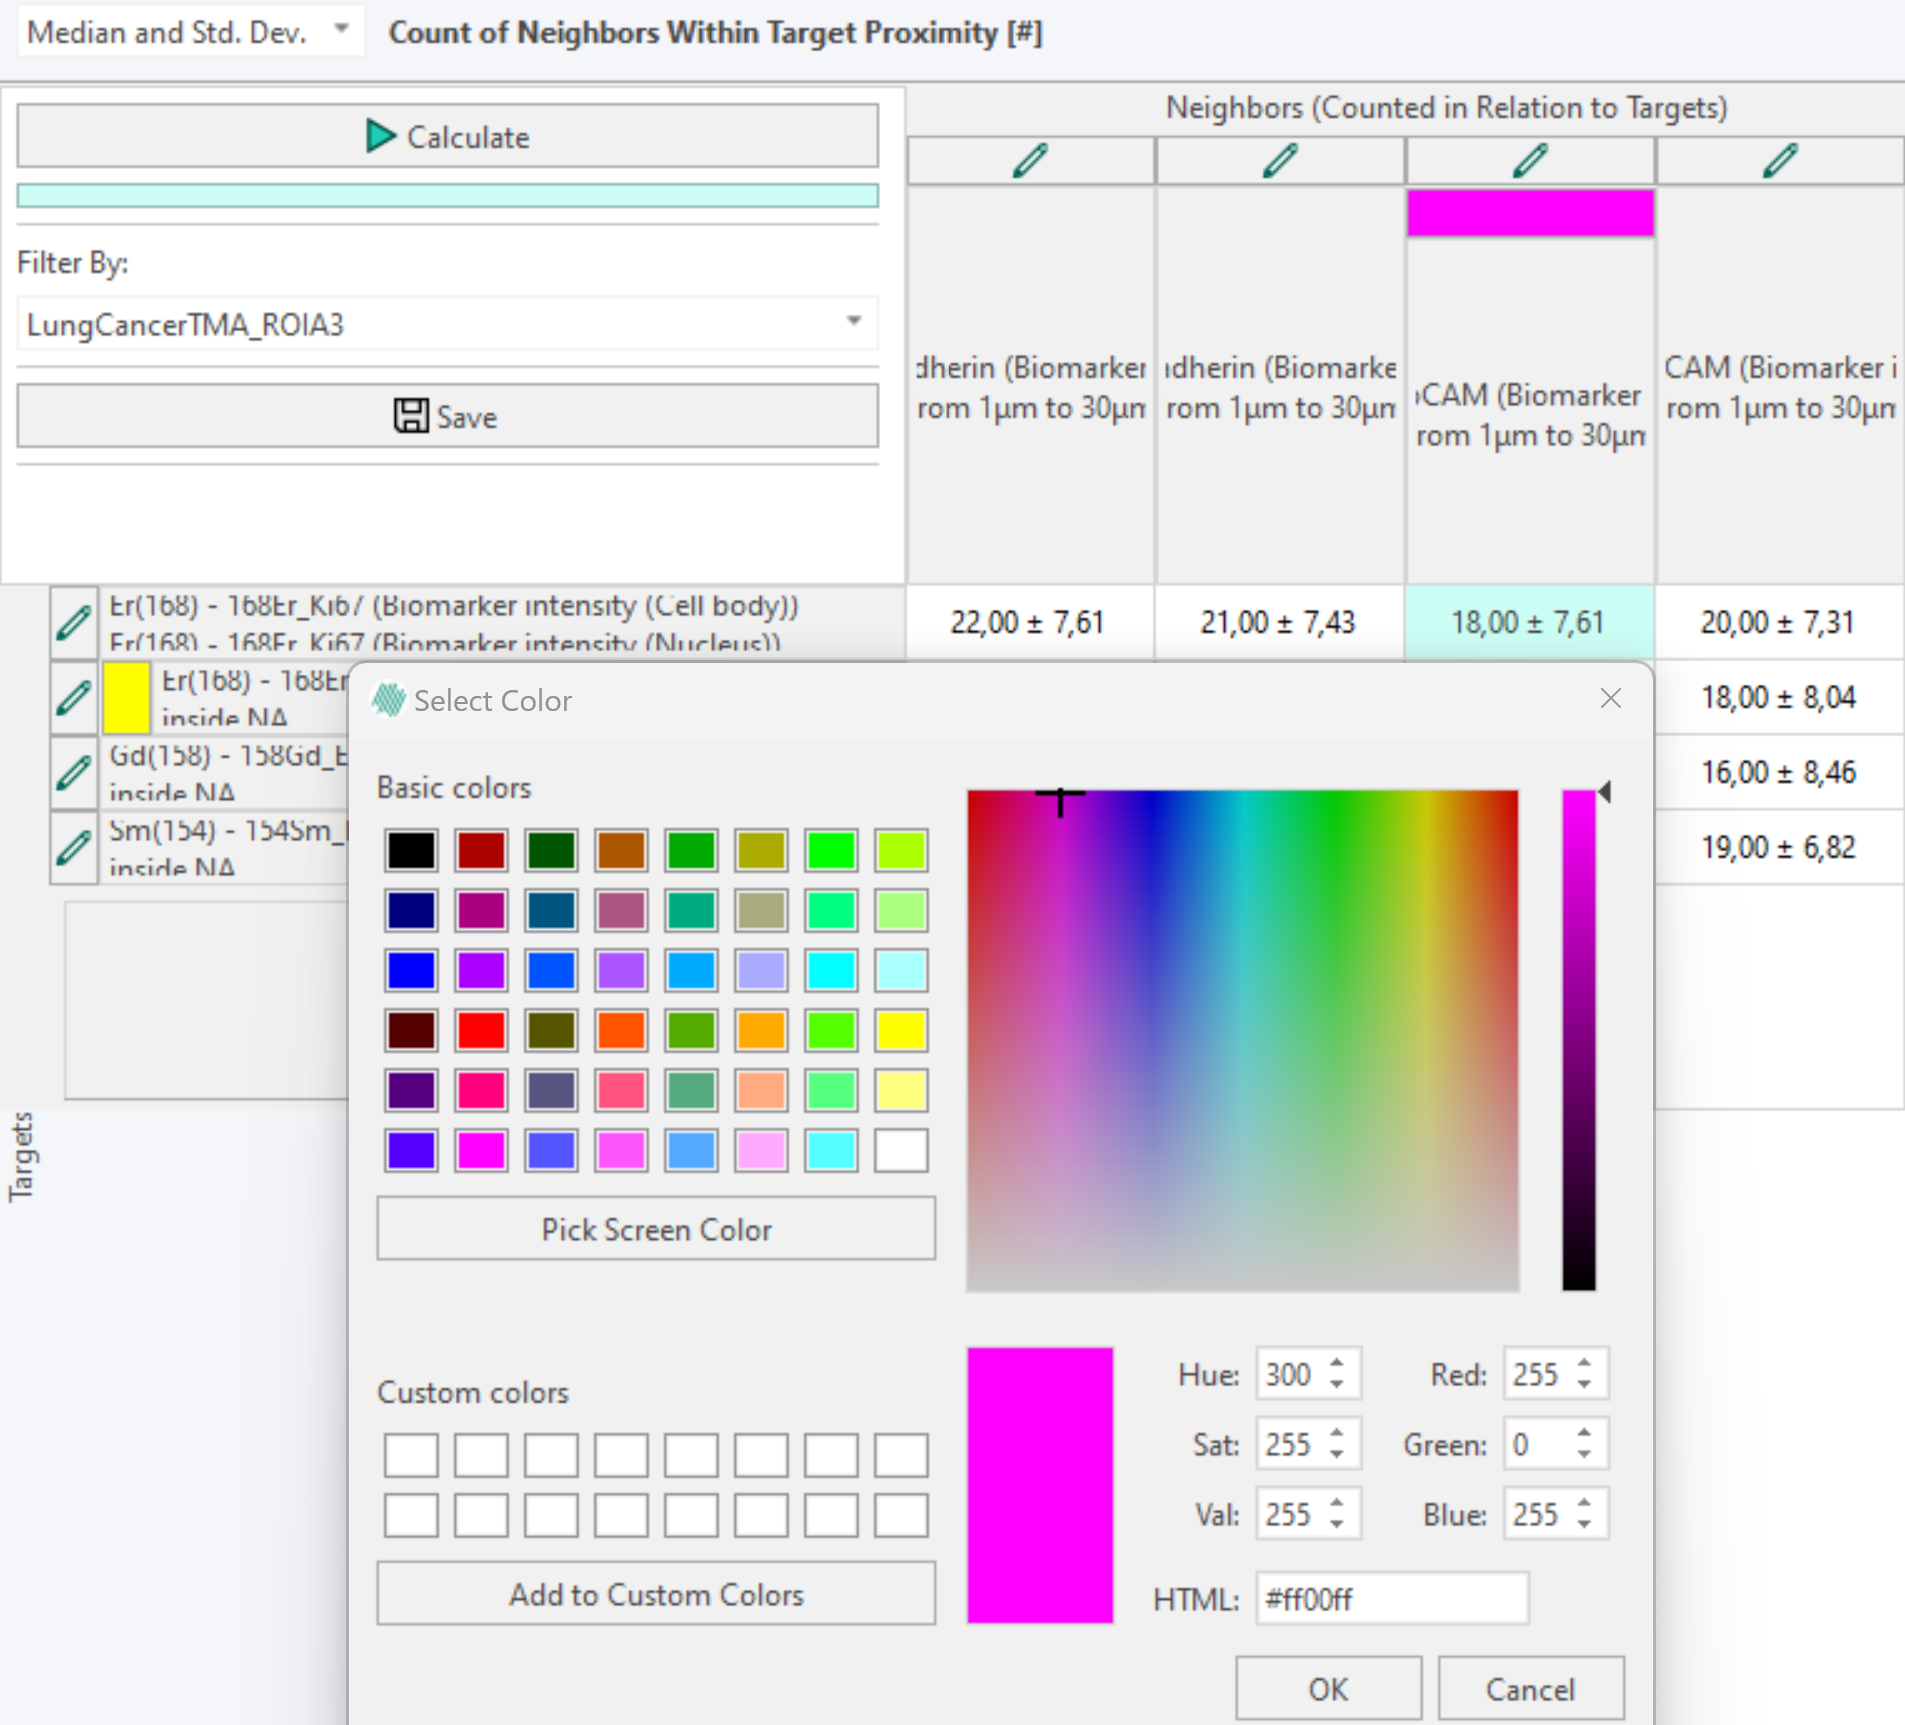
The color is only updated in the selected row and/or column, while all others stick to the default yellow and magenta colors. Unless specified differently by the user.
Any generated data can be selected in the matrix and copied to Excel or any other program using the Ctrl+C and Ctrl+V keyboard shortcut.