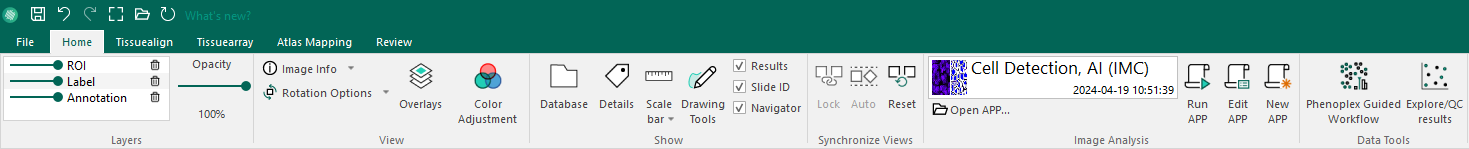
Ribbon
The Visiopharm Ribbon includes a set of tabs, one for each installed Visiopharm module. These tabs we will refer to as Module tabs. Each module tab contains some general buttons, and some module specific controls. Within each module tab, the graphical buttons and controls are grouped by functionality.
From the Visiopharm Ribbon, you are able to select a module by clicking the module tab or access general settings from File.
The Visiopharm Ribbon also includes a Quick Access Toolbar, which includes shortcuts buttons for undo/redo, saving your data and Full Screen-mode:
| Icon | Description |
|---|---|
| Saves all data to the current place in the database | |
Undo the last action Ctrl + Z | |
Redo the last action Ctrl + Y | |
Toggles Full Screen-mode F11 | |
| Open image | |
| Reload/update the results | |
| Release News redirect the user to a webpage with release news on the Visiopharm homepage. |
The general groups in all module tabs are:
- Layers
- View
- Show
- Synchronize Views
- Image Analysis
- Data Tools
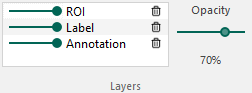
Layers
The Ribbon includes the Layers section. From the list, you can show, hide and control the transparency of individual overlay types (ROIs, Labels, Annotations, Measures, Heatmap outputs and Atlas) in the working area.
The Layers section also includes the master transparency control, which is the large slider next to the list. The master transparency control overrules the individual transparency controls of the overlay types. For optimal visualization, it is recommended to set the opacity for Labels to 70%, ensuring sufficient transparency to view the underlying image while maintaining label visibility.
- Control the transparency of each overlay type by clicking and dragging the opacity slider left or right
- Clicking once on the slider will hide/show the overlay type.
- Click the trashcan next to an overlay type will delete all overlays of that type.
Press Ctrl + L to turn the overlay on/off.
The Heatmap overlay is only visible if a heatmap output is saved with the image.
View
The View section in the Ribbon contains tools that help adjust the visual presentation of the slide in the working area. These tools do not alter the image itself; they only control how it is displayed.
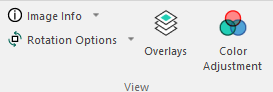
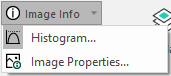
Clicking on the Image Info dropdown menu allows you to open the Image Information dialog, which displays details such as image size, resolution, offset, and pixel information. It is also possible to select the Histogram view, which visualizes different image characteristics, such as the distribution of pixel intensities across the slide.
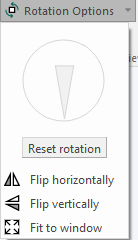
Clicking on the Rotation Options dropdown menu opens tools for adjusting the image orientation. The image can be rotated using the Rotation Wheel, to rotate the image as the wheel is turned. The image can also be flipped horizontally or vertically, or fitted to the window to ensure the entire slide becomes visible within the working area. Any rotation can be reset using the Reset rotation button.
Overlays
The Overlays menu shows every ROI, Label and Annotation currently on the image in the working area.
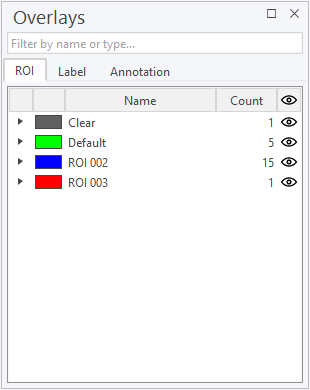
Clicking on one of the ROI classes will show where on the image this class is located
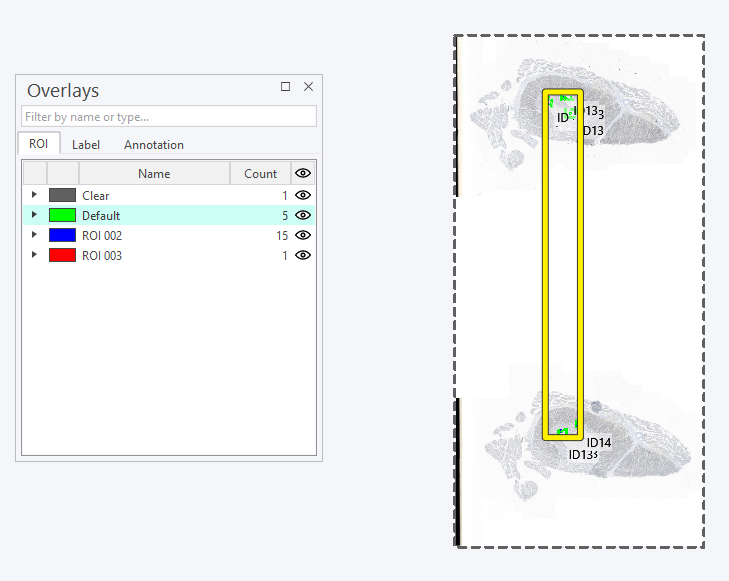
The same applies for both Labels and Annotations.
Clicking the eye icon next to count will toggle the visibility of the class. This can also be applied to every class by clicking the eye in the top column.
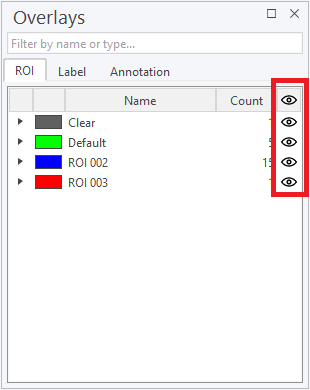
The same applies for both Labels and Annotations.
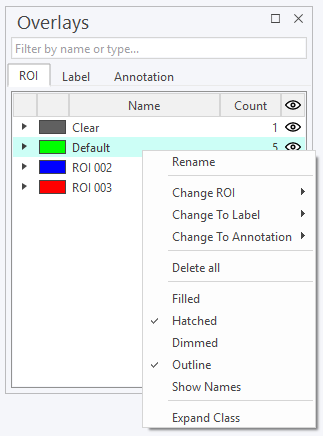
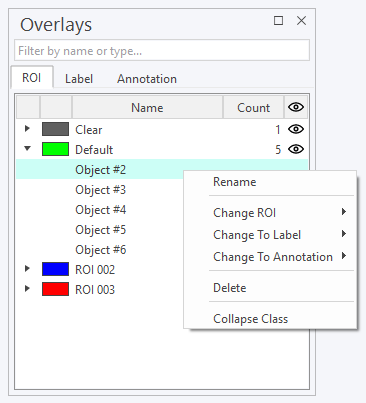
Right-clicking on a class or an individual object opens up a menu.
| Option | Description |
|---|---|
| Rename | Rename the class. |
| Change ROI | Change the ROI class to a different ROI class. This can also be done for Label and Annotation classes. |
| Change To Label | Change the ROI class to a Label class. This can also be done for Label to ROI/Annotation and Annotation to ROI/Label. |
| Change To Annotation | Change the ROI class to an Annotation class. Same as above. |
| Delete all | Deletes every object in the class. |
| Filled | Toggles between filled and unfilled view. |
| Hatched | Toggles between hatched and unhatched view. |
| Dimmed | Toggles between dimmed and undimmed view. |
| Outline | Toggles the outline around objects in the class. |
| Show Names | Toggles the visibility of names. |
| Expand Class | Expands the class so each object is visible in the Overlays menu. |
| Option | Description |
|---|---|
| Rename | Rename the object. |
| Change ROI | Change the ROI object to a different ROI object. This can also be done for Label and Annotation objects. |
| Change To Label | Change the ROI object to a Label oject. This can also be done for Label to ROI/Annotation and Annotation to ROI/Label. |
| Change to Annotation | Change the ROI object to an Annotation object. Same as above. |
| Delete | Deletes the object. |
| Collapse Class | Hides the objects in the class. |
Color Adjustment
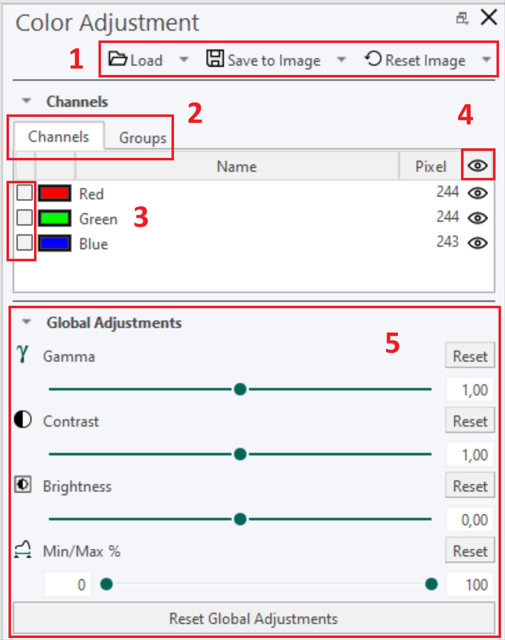
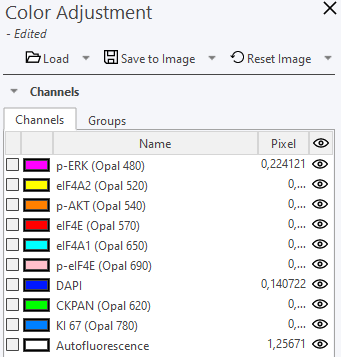
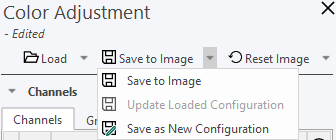
The Color Adjustment menu is opened by selecting Color Adjustment in the View group in the Ribbon.
The Color Adjustment menu lists all available color bands from the image and allows for a quick selection and visualization of all or just specific bands/channels of interest.
-
Changes to an image, including color adjustments, can be saved. Save configurations and apply them to other images by selecting "Load" and choosing the configuration. To reset the image, click "Reset Image."
-
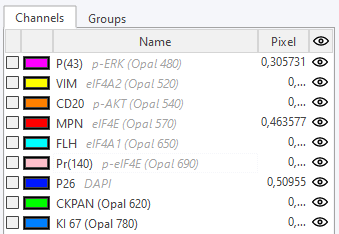
Work with individual channels or create groups for easier adjustments.
-
Adjust colors by selecting or double-clicking the desired color box.
-
Toggle color visibility with the eye icon. The number next to it shows color intensity. Click the top eye to hide or show all channels.
-
Adjustments apply in real time unless a specific color is selected.
The Color Adjustment dialog controls the way images are displayed. By using the Color Adjustment dialog, the user can change brightness, contrast etc. For color images, the properties can be adjusted individually for each color band and the bands can be hidden or shown individually. Furthermore when displaying only one band the image can be shown in several pseudo colors.
Global / Band adjustments controls the adjustments made to the image, including Gamma, Contrast, Brightness, and Min/Max levels in %.
- Gamma is shorthand for gamma correction and can be adjusted to encode or decode the luminance values of the selected channel(s).
- Contrast and Brightness can be adjusted to change the contrast or brightness respectively of the selected channel(s).
- Min/Max % adjusts the distribution of light in the selected channel(s) based on the range between the min and max values.
Groups enable the organization of specific color channels, particularly useful when working with images that contain multiple channels, allowing focus on relevant ones. To create a group, select "Group" from the channels menu. The interface will then update accordingly, allowing for easier channel management.
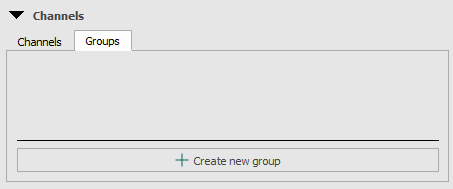
Groups can be created with selected channels as needed. Each channel can be assigned to multiple groups.
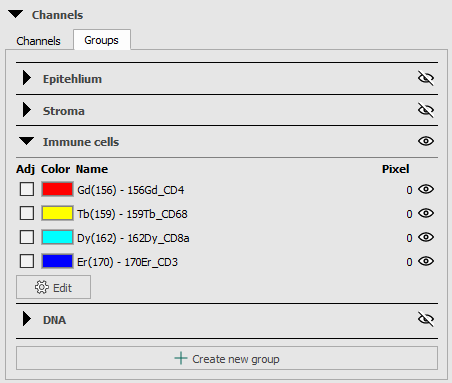
When a group is selected, only the channels associated with that group will be displayed in the image, providing a focused view of the relevant data.
Adjust colors of multiple images simultaneously in Multiview
Use the dropdown menu to select the image for adjustment. If all selected images share the same configuration, they can be adjusted simultaneously through the global adjustment menu.
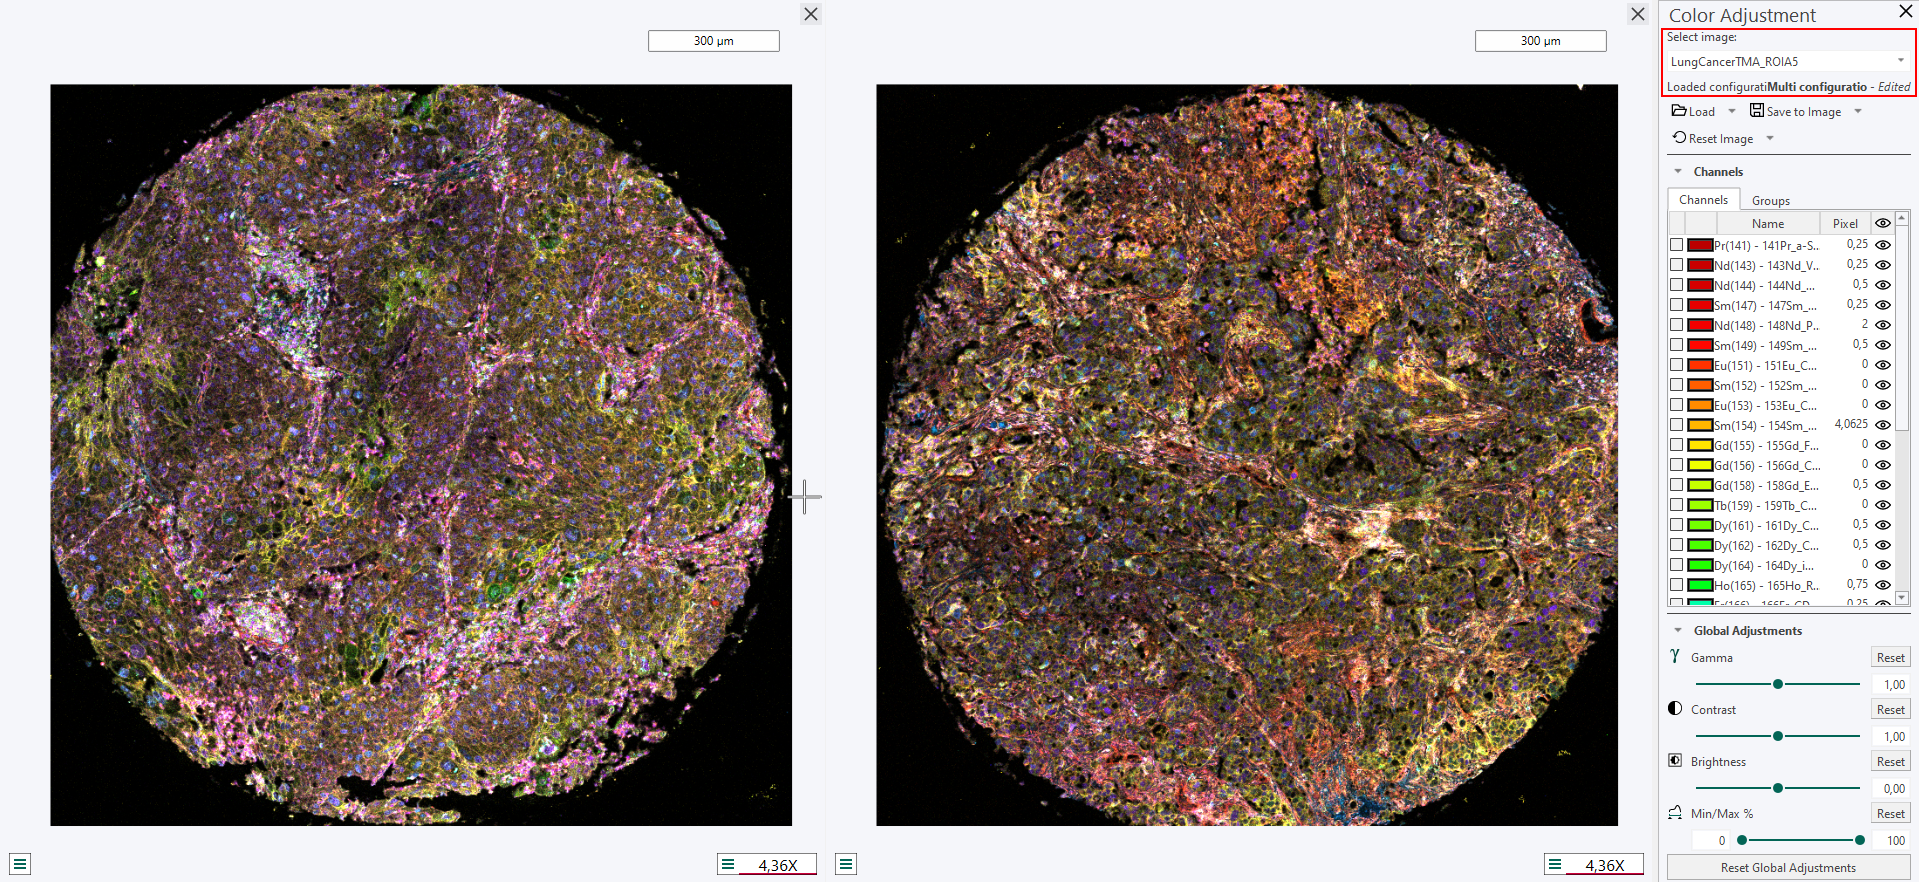
When the colors of an image is adjusted then all other images that use the same color configuration will simultaneously be updated. Notice that this can only happen if the image uses a "named" configuration, i.e. a configuration that is saved in the database and can be loaded/used by other images. If an image has an image specific configuration or no saved configuration then only that image will be updated.
To visualize all channels in co-registered multiplex images, this feature can be found in the Tissuealign section.
Renaming of channels
Start by opening the Color Adjustment Tool.
Click on the channel name to rename it. Enter the preferred name and press Enter. The updated name will be displayed, while the original channel name will remain visible in grey for reference.
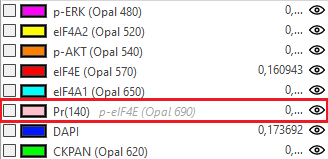
Update all the channel names as needed and finally save the channel renaming to a color profile through: Save to Image, Save as New Configuration or Update Configuration.
When the configuration has been saved it can be be loaded to other images of the same assay.
You can enable/disable color profiles under File -> Options -> More Options -> check/uncheck Color Profiles
It is generally advised that all name changes are performed before the cell segmentation and output generation steps for subsequent analysis. This assures that all name changes are subsequently passed through to all workflows and readouts. Any name chanes performed after the output generation are not passed through to the database results and require a re-analysis.
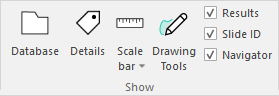
Show
The Show section provides options to toggle the visibility of key visual elements within the Visiopharm Ribbon. These elements assist in navigation, interpretation, and documentation of image analysis results.
Database and Details
Clicking on either Database or Details will toggle the visibility of them. For more information, go to the Database section.
Scale bar
clicking on Scale bar toggles a scale bar to the image to indicate physical dimensions.
The scale bar box in the corner of the image-window is displaying the current scale (the unit can be selected in the dropdown menu). To activate the scale bar, select Scale Bar in the Ribbon panel. A menu beneath the scale bar allows selection of the corner where the scale bar should appear. The scale bar automatically updates when zooming in and out on images.
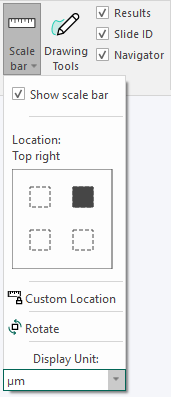
The Display Unit can be set to show the following units: Pixel, nm, μm, mm, cm, m, and Inch.
It is possible to set the unit in both Advanced Setup under the input section in APP Author and in the Ribbon.
- When loading APPs from the Ribbon Auto/Tune UI, the general UI will change to match the unit of the APP.
- When creating a New APP, Author will initialize using the unit selected in the Ribbon bar.
- A warning will be shown when trying to use old measures that do not match the currently selected unit.
To resize the scale bar dynamically, press and hold Ctrl + Shift, then use a left-click drag motion on the scale bar. The scale bar will adjust its size according to the dragging motion.
Drawing Tools
Clicking on Drawing Tools toggles the visibility of the Drawing Tools floating toolbar. For more information, go to the Drawing Tools section.
Results, Slide ID and Navigator
-
Results: Displays the results of the image analysis, including overlays and annotations generated by the analysis protocols.
-
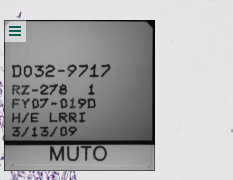
Slide ID: Shows the unique identifier of the current slide, aiding in traceability and organization when working with multiple samples. Advanvced /more setting for the slide ID can be found by clicking
 , once the Slide ID has been toggled on in the Ribbon menu.
- Navigator: Opens the Navigator window, which provides an overview of the entire slide. This is useful for quick navigation and orientation. The Navigator window is located in the bottom right of the working area and shows a full view of the entire image along with a yellow square displaying the area currently visible in the working area. Advanced settings for the Navigator can be found by clicking , once the Navigator has been toggled on in the Ribbon menu.
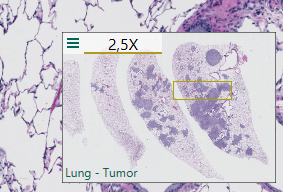
Navigator window for a Lung-Tumor image.
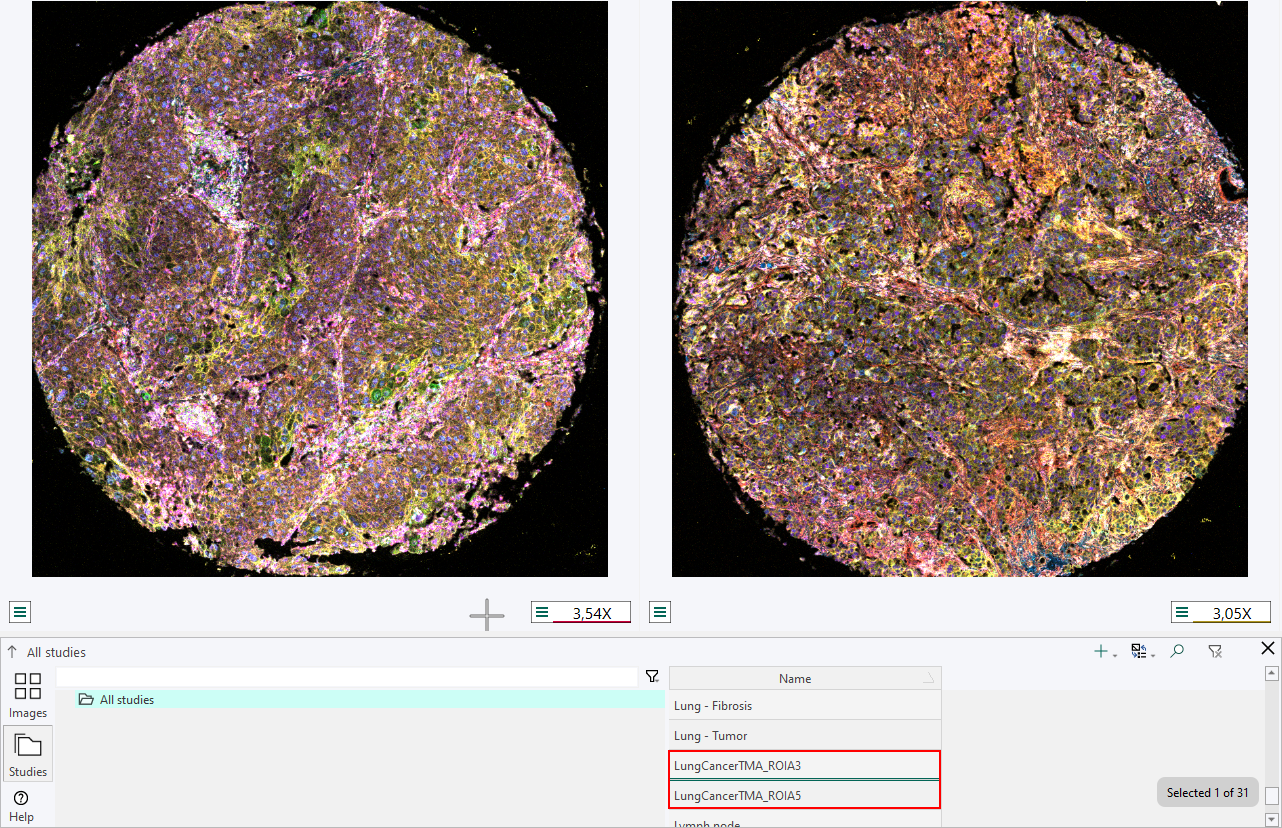
Synchronize Views
To open multiple images simultaneously, simply select two or more images and press Alt + Enter. This shortcut allows for efficient management of multiple images within the application interface.
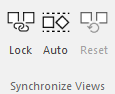
| Item | Description |
|---|---|
| Lock | Move and zoom is syncronized between the images |
| Auto | Automatic allignment |
| Reset | Reset to default zoom and allignment |
Data Tools group
The Data Tools can be found in any of the module tabs.
| Icon | Description |
|---|---|
| Information about the Phenoplex Guided Workflow tool can be found in the Phenoplex section. | |
| Information about the Explore/QC results tool can be found in the Explore/QC results section. |
Show/Hide the Ribbon
Double-click the active tab (e.g., Home) to show or hide the ribbon. This feature is useful for maximizing the working area or taking screenshots.