Classified Image
If Classified Image is selected as input, no further selections of input should be made. The calculations are based on the labels, and are all of a morphometric nature.
- Calculate - Choose the morphometric feature to calculate.
- Label - Specify one or all of the labels on which the calculation should be performed.
- ROI - Specify one or all ROIs to limit the object. Only labeled pixels inside the ROI(s) are used in the calculation. It is also possible to choose not to use any ROIs to limit the objects.
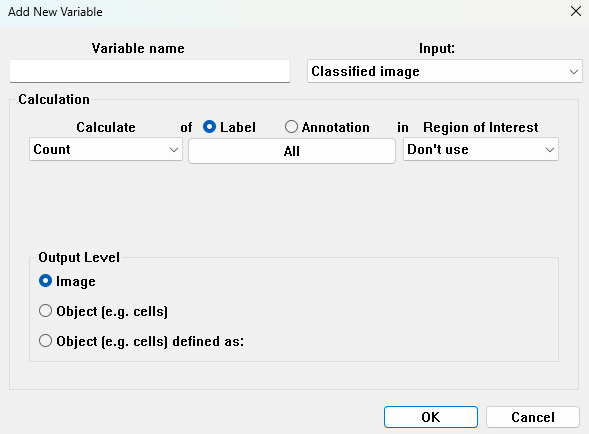
- Variable name - Specify a name for the variable. If the name is already used, the variable is not added to the list.
- Limit calculations to the inside of the counting frame - Only available when a counting frame is added in the preproccesing steps.
Calculate
The following calculations can be performed on the classified image:
Count
Count calculates the total number of objects with the specified label/annotation.
Area
Area calculates the complete area for all objects with the specified label/annotation. By default a counting frame will be applied, which can be disabled by clicking the corresponding box. This should only be done when working on larger objects, which span multiple analysis tiles.
Eccentricity
Eccentricity calculates the mean eccentricity measure of the objects with the specified label/annotation. Eccentricity is calculated as the fit of an ellipse to the object. The fitted ellipse has the same second order central moments as the object, and is a circularity measure defined as:
where is the length of the major axis and is the length of the minor axis of the fitted ellipse. The eccentricity will equal 1 for a line and 0 for a circle.
Form Factor
Form factor provides a measure of how closely the shape of an object approaches a perfect circle. The Form Factor is defined as:
where the is the area of the simplified object and is the perimeter of . The Form Factor is a value between 0 and 1, where a perfect circle has a form factor of 1, and is found as the mean of the Form Factors for the chosen objects.
As Visiopharm software works with raster images, where no label can be perfectly smooth, and due to the coastline paradox, most form factors are 1%-10% smaller than their theoretical counterparts.
For more information: Form Factor in Post Processing.
Convexity
Convexity is the mean of the convexity of the specified label/annotation. The convexity is defined as:
where is the perimeter of the simplified object of the convex hull of an object, and is the perimeter of the simplified object. The resulting value will be between 0 and 1.
For more information: Convexity in Post Processing.
Solidity
Solidity is the mean of the soldity of the specified label/annotation, and is defined as:
where is the area of the simplified object of the convex hull of an object, and is the area of the simplified object. The resulting value will be between 0 and 1.
For more information: Solidity in Post Processing.
Ellipticalness
Ellipticalness is the mean of the ellipticalness of the specified label/annotation, and is defined as:
where is the area of an ellipse fitted to the object, is the area of the simplified object, and are the axes of the ellipse fitted to the object. Ellipticalness is a value between 0 and 1 which represent how identical the object is to an ellipse, with 1 corresponding to an ellipse.
Perimeter
Perimeter is the total perimeter of all objects in the specified label/annotation.
Largest and Lesser Diameter
Largest Diameter and Lesser Diameter are two distinct measurements that provide insights into the size of an object in an image.
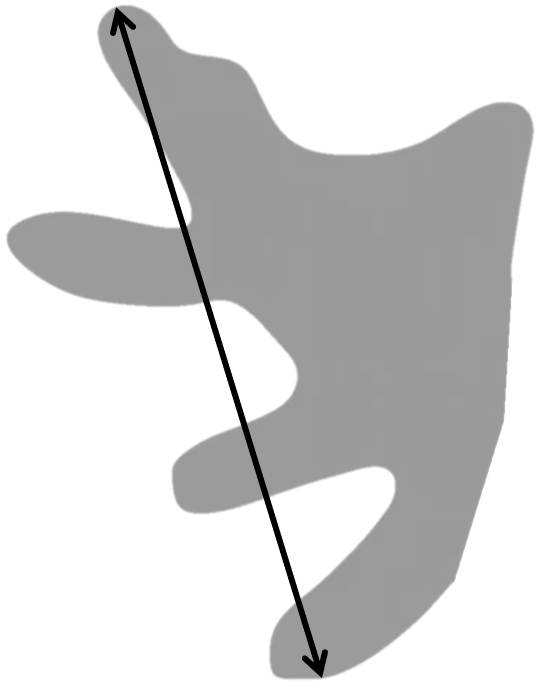
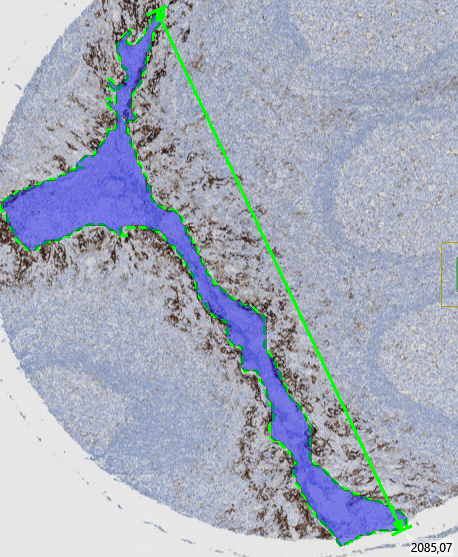
Largest Diameter
The Largest Diameter is a morphological measurement that identifies the maximum straight-line distance across an object, it's calculated as the maximum straight-line distance between any two points on the boundary of a labeled object.
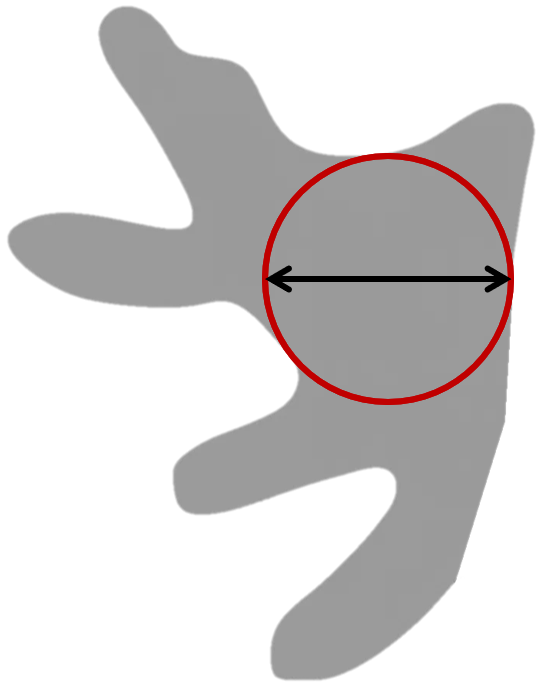
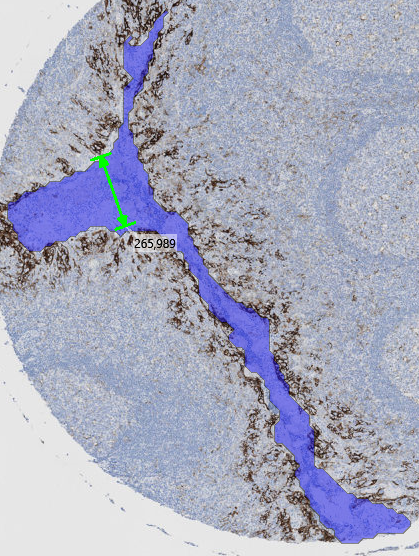
Lesser Diameter (Maximum Inscribed Diameter)
The Lesser Diameter is a morphological measurement that identifies the diameter of the largest circle that can fit completely within an object. When analyzing tissue samples, this measurement helps quantify the widest internal width of the object. Its calculated as the diameter of the largest inscribed circle that fits entirely within a labeled object.
In elongated or constricted objects (e.g., vessels, crypts), the Lesser Diameter reflects the size of the most open region — not the narrowest point.
Major Axis Length and Minor Axis Length
The Major Axis Length and Minor Axis Length are calculated as the length of the major and minor axis of an ellipse fitted to the object. The fitted ellipse will have the same second order central moment as the object. The resulting variable will be the sum of all calculated axis lengths, for either the major or minor axis.
If the button "Draw Outputs" is ticked, then the calculated axis will be shown as an annotation in the image.
Orientation
Orientation calculates the mean orientation of the specified label/annotation, relative to either horizontal, vertical, or a selected measure. The orientation is given in radians as the orientation of the major axis of an ellipse fitted to the object.
If the button "Draw Outputs" is ticked, then the major axis of the fitted ellipse will be shown as an annotation in the image.
If the Output Level is set to image, then the mean orientation of all objects is found, but if set to Object (eg. cells) the orientation of each object is found.
Connectivity
Connectivity is a measure calculated on the size distribution of all specified label/annotation membrane fragments remainning after any (optional) post-processing steps. The size of each membrane fragment is defined as its area. The connectivity measure is most suited for applications where the membrane stain displays "chiken wire" like structures.
The connectivity is defined as the area under the curve in a graphic representation of ratio between Y and X:
where is a cutoff value defining membrane fragments too small to be included in the estimated connectivity, and is a cutoff value for membrane elements that are too large. is a dynamic dynamic cutoff varying between and . is the total area of all membrane fragments, and is the total area of membrane fragments larger than .
The value of can be changed by entering a value for Object Size Cutoff. If the total area of detected membrane is less than this value, the connectivity calculation will result in 0. For an in-depth explanation of this approach, please refer to this paper Digital image analysis of membrane connectivity is a robust measure of HER2 immunostains.
Interface Length
Interface length calculates the total length of the interface (common border) between two labels, two ROIs or labels within an ROI. Master refers to the object measured from and Reference to the object measured to.
- Under Reference label and Reference ROI choose which label, and in what ROI, to use as reference.
- Under Master label and Master ROI choose which label, and in what ROI, to use as a master. The interface length is then calculated by locating pixels of reference phase in contact with the master phase. If no pixels in the specified labels/ROIs are in cotact with each other, the calculated interface length will be 0.
Object Distance
Object Distance is the mean of the shortest distances between the edge of a specified label/ROI and the edge of another object of the same type (label/ROI).
-
From Label or Region of Interest - Select the object type, from which the distance should be calculated from.
-
To Label or Region of Interest - Select the object type, to which the shortest distance should be calculated to.
Please note that only one object type can be selected at a time. If From Label is selected, then Region of Interest should be set to "Don't Use," and vice versa. Selecting multiple object types will result in an error message.
It is possible to choose the same label to measure from and to, which will find the mean distance between objects of this label.
Left, Right, Top, Bottom
Left, Right, Top, or Bottom calculates the position of the leftmost/rightmost/bottommost/topmost pixel for the specified label/annotation in relation to the centre of the image.
If working with an image that is 320 µm wide and 240 µm tall, the leftmost pixel in the image would have a value of -160, the rightmost pixel would have a value of 160, the topmost pixel would have a value of 120, and the bottommost pixel would have a value of -120.
If the Output Level is set to Image, only one value will be found, and if Object (eg. cells) is chosen, a data set of pixel positions for each object will be calculated.
Center X and Center Y
Center X or Center Y will calculate the x- or y-coordinate for the center of mass for the specified label/annotation. The values relate to the centre of the image and are given in µm as when using Left, Right, Top, or Bottom.
If the Output Level is set to Image, the mean value will be calculated, and if Object (eg. cells) is chosen, a data set of pixel positions for each object will be calculated.
Region of Interest
The Region of Interest will calculated the boundary of the specified label/annotation. The boundary of the outlining box is given in mm and is in relation to the centre of the image, where left and down from the centre are negative values, and right or up from the centre are postive values. If the Output Level is set to Image, the outlining box will include all relevant objects, and if Object (eg. cells) is chosen, an outlining box will be calculated for each object.
H-Score
H-score is a quantative measure for evaluating immunohistochemistry results. Instead of only classifying nuclei as negative or positive, the H-score uses three sub-classifications for positive nuclei based on the staining intensity. The classifications are named 0 (or negative), 1+, 2+, and 3+ with increasing stain intensity. In contrast to other variables, the input will always be the entire image, where it will calculate the h-score for all labels.
The H-score is based on the total number of classified cells, and not the area of each classification. It is calculated using the following formula:
Using this formula, more intensely stained nuclei are weighted more than weakly stained nuclei. The H-score ranges between 0 and 300, with 0 corresponding to only negative cells, and 300 corresponding to only 3+ cells.
When H-score is selected, it must be setup, which can be done in the setup menu that automatically opens, or by clicking the ![]() button.
In this menu, specify which labels correspond to each cell classification. Type 0 should be set as the label containing negative nuclei. 1+, 2+, and 3+ should be set as labels containing positive nuclei based on their intensity.
button.
In this menu, specify which labels correspond to each cell classification. Type 0 should be set as the label containing negative nuclei. 1+, 2+, and 3+ should be set as labels containing positive nuclei based on their intensity.
Object Info
Object Info is an output variable that will save the Label type, Label name, ROI type, ROI name and Envelope for a specified label in a ROI. It is necessary to have Object Info as an Output Variable to employ the Explore/QC Results and Phenoplex tools. For each object (often a cell) the Object Info Output Variable will return the following outputs:
- Label type is the number corresponding to the label., e.g 1 if it is the first label, 2 if the second label and so forth.
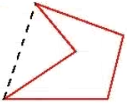
- Label name is the name of the label. For composite objects (ie. those consisting of more than one touching label,) the Label Name is reported as the label with the largest area, an example is illustrated below:
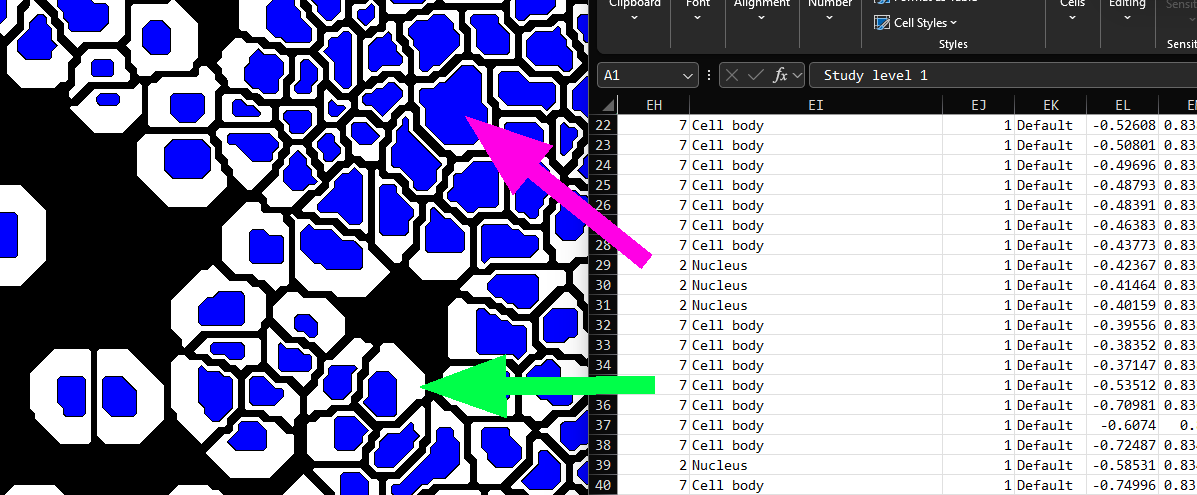
-
ROI type similarly to the Label type, ROI type is the number corresponding to the ROI.
-
ROI name similarly to the Label name, ROI name is the name of the ROI.
-
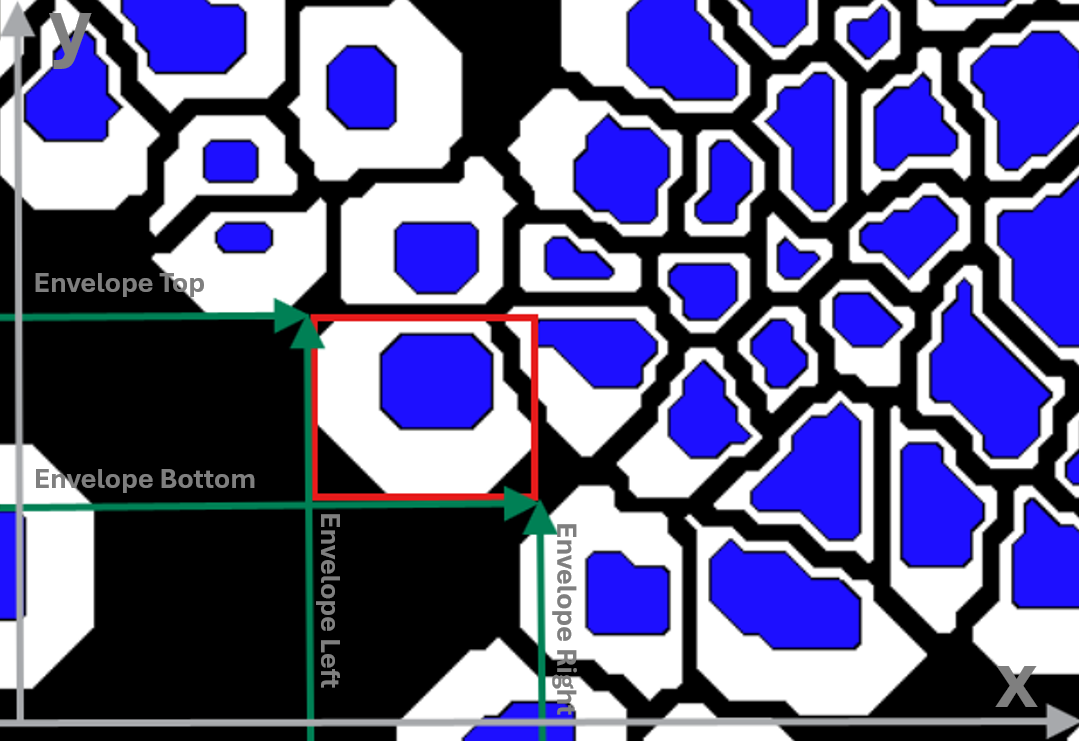
Envelope is the smallest bounding box that fully contains the object label. The envelope is defined by the upper-left and bottom-right corners of this bounding box. It is saved to the Object info as the four corners of this bounding box. These coordinates are stored in the Object Info as:
Envelope Top: the largest y-value (top edge of the box)
Envelope Bottom: the smallest y-value (bottom edge of the box)
Envelope Left: the smallest x-value (left edge of the box)
Envelope Right: the largest x-value (right edge of the box)
Together, these coordinate values represent the upper-left (Left, Top) and bottom-right (Right, Bottom) corners of the box. Envelope can be very useful, for instance when estimating object centers, but be aware that it may be misleading for highly curved object, where the box center risks being outside the object.
- Object ID is a unique ID (GUID style) made from the envelope of the object.
The Object Info variable can be added to the Output Variables by clicking New Variable and selecting it under Calculate. When selected, the configuration page looks slightly different from other output variables: the middle dropdown is now called Source Label.
The Source Label specifies which label the Object Info should be retrieved from. When configuring the Object Info, it is important to choose a Source Label that reflects which part of the object you want information from. When All is selected as the Source Label, any labels that touch each other will be treated as one single object, even if they belong to different label types. For instance, in cell-analysis workflows, the object may be defined either by the cell body label or by the nucleus label. If the object should be considered as a composite structure consisting of both the nucleus and the cell body, selecting All allows these labels to be merged into one object.
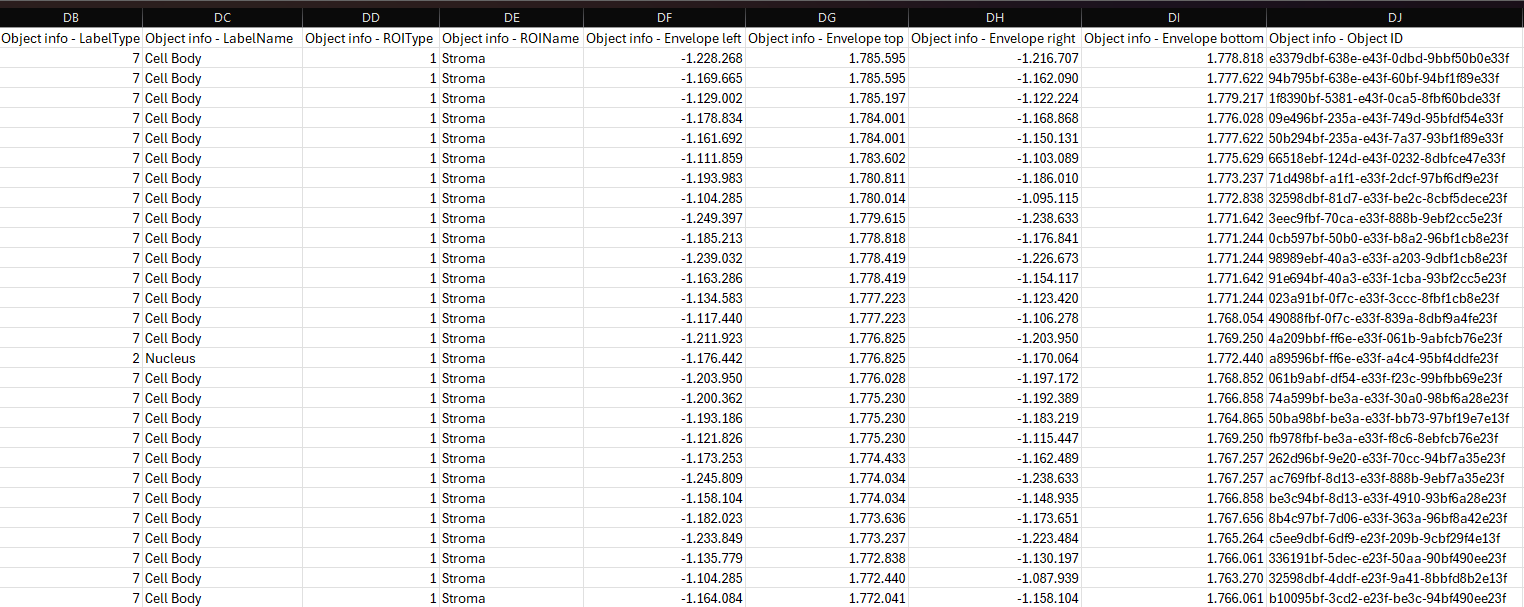
In order to use the Explore/QC Results and Phenoplex tools, ensure that the dimensions are the same for Object Info and any other Data Sets saved to the image. To examine the dimensions, ensure that the Output Variables are saved to the image, and then double-click the Data Set in the Database. This will open a Result-file Viewer, where the first line contains the number of datapoints, the number of variables, and the number 1. The number of variables is 9 for Object Info (Label type, Label name, ROI type, ROI name, Envelope Top, Bottom, Left, Right, and Object ID) and 1 for most other Output Variables, but only the number of datapoints needs to match. To ensure the same dimensions, if “Object (e.g. cells) defined as” is chosen as the Output Level for an Output Variable, it should be chosen for all Output Variables.
To further inspect the Object Info dataset, it is possible to export it to a TSV file by right-clicking on the Object Info dataset in the database. The exported file can then be opened and inspected in Excel.