Nearest Neighbor
The feature Nearest Neighbor in the Phenoplex Guided Workflow can be used to understand the spatial relationships between specific biomarker-positive targets and neighboring objects within a defined distance.
The selection of targets and neighbors is based on their positivity for biomarkers defined in the Threshold Step of the Guided Workflow. It is possible to combine multiple thresholds to define specific phenotypes. For instance; selecting CD3, CD4 and CD45 can indentify T helper cells within images. Only objects which are positive for all specified biomarkers will be considered for distance measurements.
To perform a distance analysis, a previously saved threshold result must exist in the database.
Nearest Neighbor analysis
Two Key distinctions
The workflow for defining targets and neighbors for distance measurement closely resembles that of Neighbor Counts. However, there are two key distinctions:
-
Values in the resulting table represent distances in micrometers (µm).
-
The new neighbor measurements are configured to analyze distances within specified regions of interest (ROIs) from the target cells. Any neighbors beyond the defined threshold, are excluded from analysis.
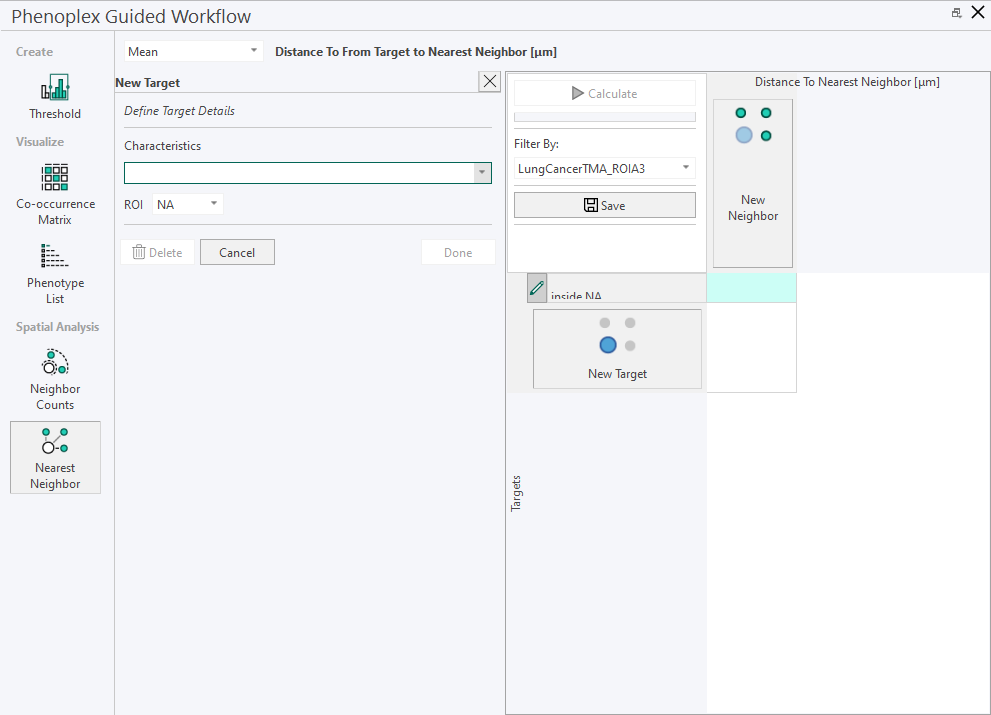
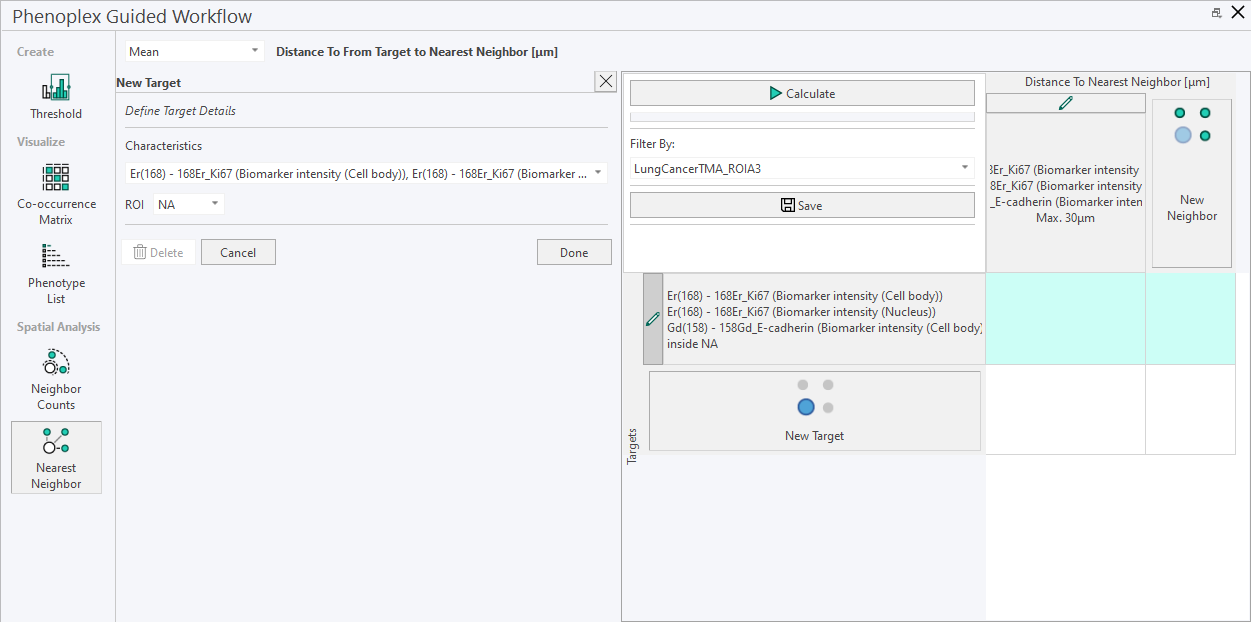
New Target
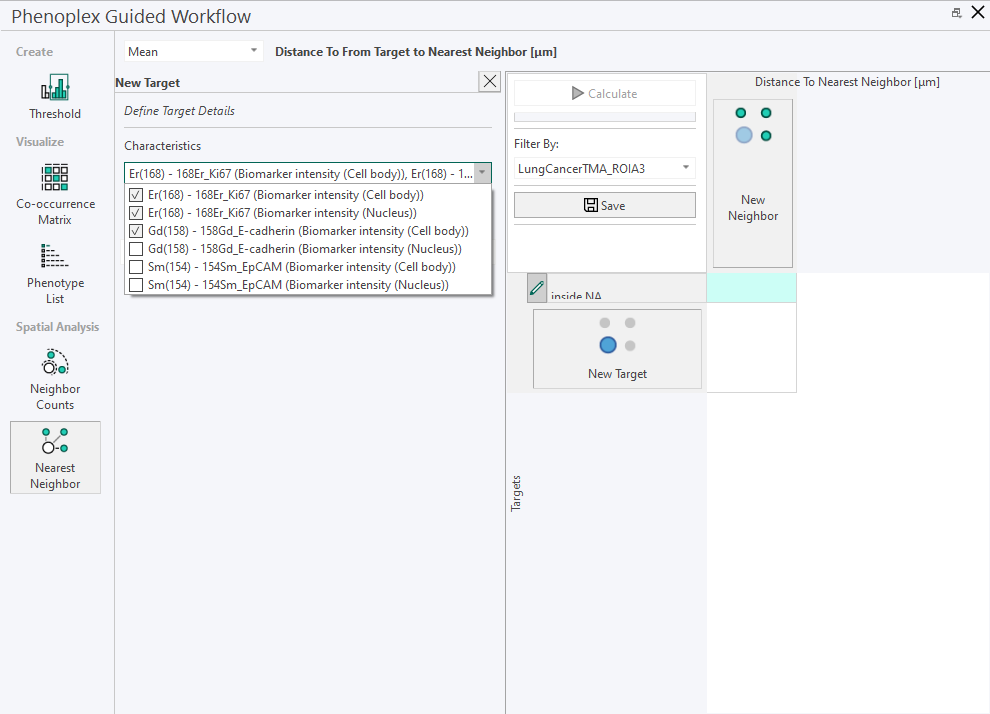
- Click on New Target, and a side panel shows up. This is a placeholder to indicate that you are editing the matrix. In the side panel, characteristics(variables) can be selected to describe the Target.
- Select all relevant variables, and click Done. The New Target(s) will be added to the matrix.
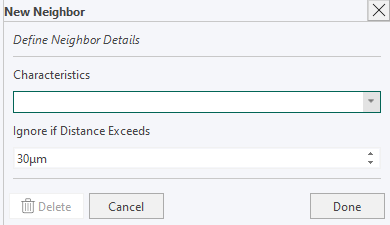
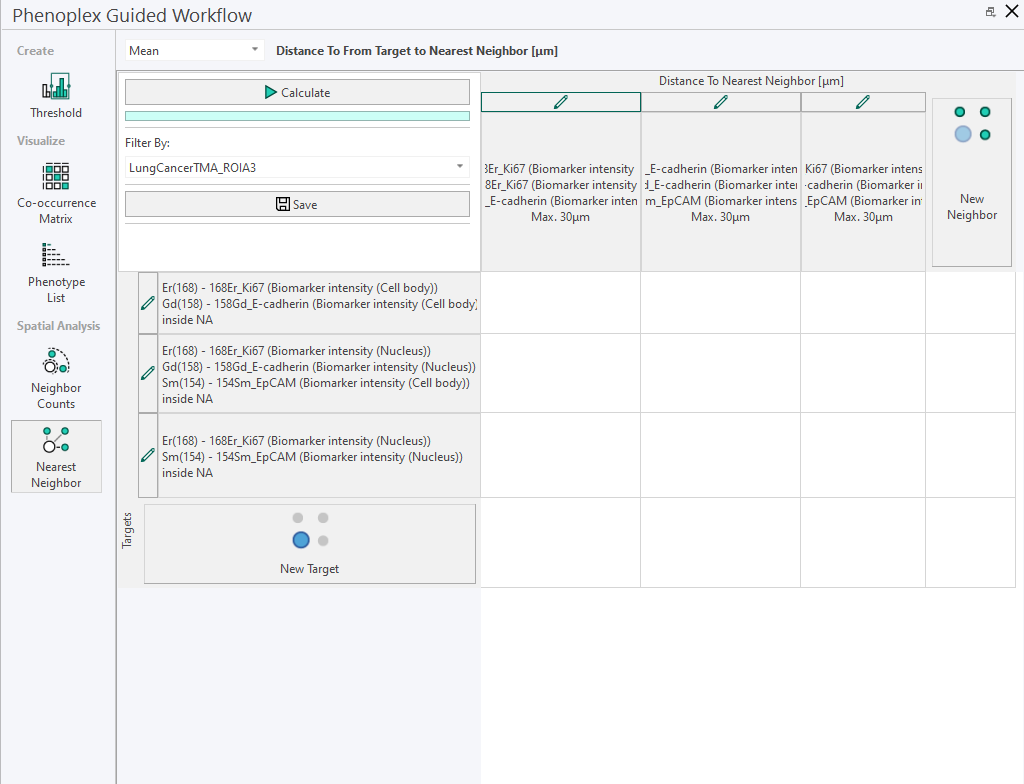
New Neighbor
The process for creating New Neighbor(s) is similar to creating New Targets. In the side panel, the characteristics and the relevant distance from the target can be defined. By default, the minimum distance is 0.
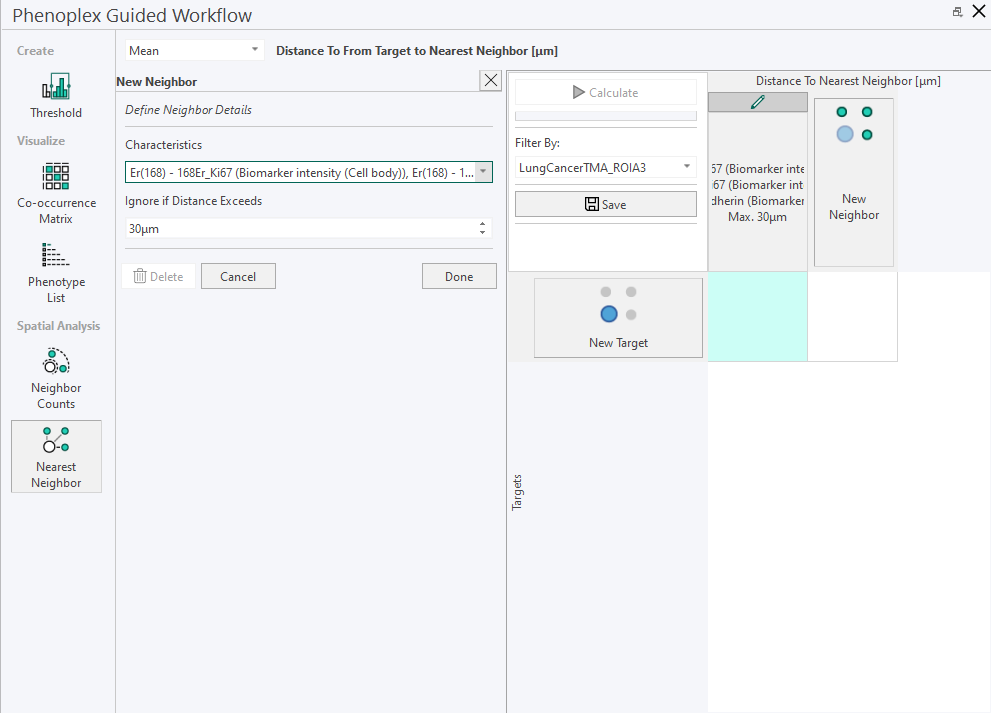
Editing any target/neighbor can be done by clicking on the little pencil next to target/neighbor.
Calculate Nearest Neighbor
Once the Targets and Neighbors are defined, click Calculate to start the calculation. Progression in the calculation can be accessed in the progress bar below the Calculate button.
Filter By Nearest Neighbor
You can switch to other image results in the Filter by menu.
When you switch to another image, the table is updated with the results from the newly selected image.
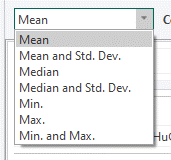
To change to different statistical values in the table, use the drop-down menu.
Highlighting Nearest Neighbor
Selecting a cell in the matrix, lets you view the target-neighbor pair.
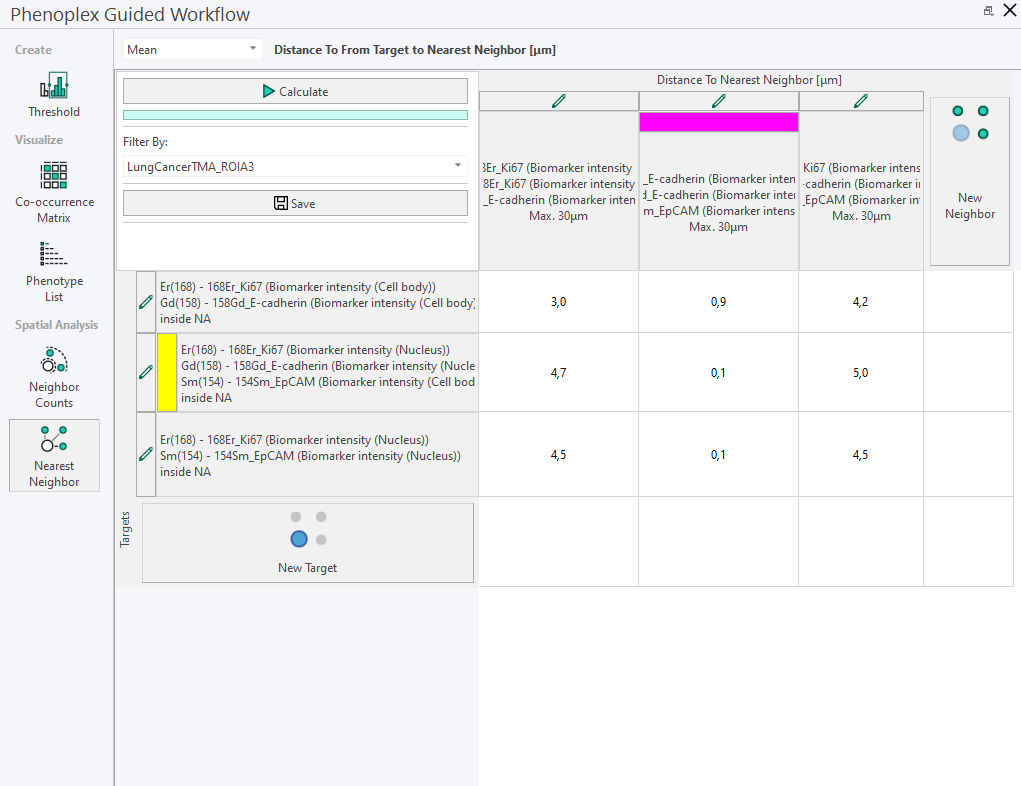
Change Colors in Nearest Neighbor
Clicking on the yellow and magenta color field opens a color picker to update colors as needed by the user:
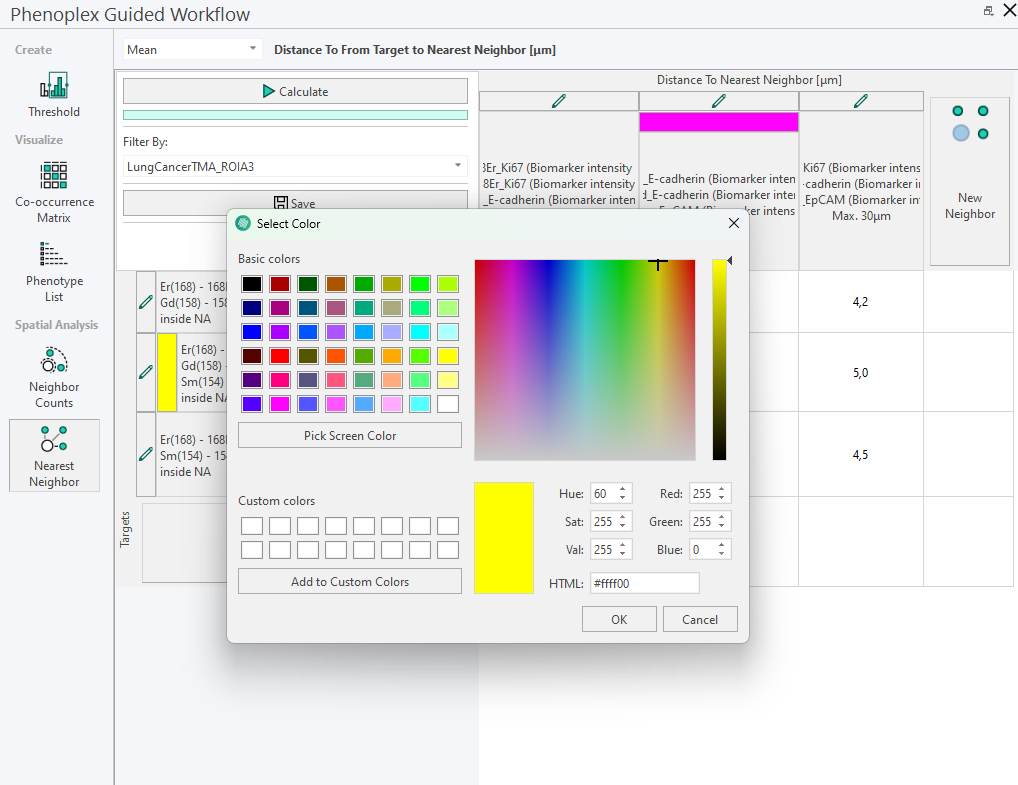
The color is only updated in the selected row and/or column, while all others stick to the default yellow and magenta colors. Unless specified differently by the user.
Save Nearest Neighbor
The Save button saves the selection of Targets and Neighbors including distance and ROI selection as a preset to the Database. Save the plot to the database and reload it by selecting the images and opening the Phenoplex Guided Workflow tool again.
Any generated data can be selected in the matrix and copied to Excel or any other spreadsheet program using the ctrl+C and ctrl+V keyboard shortcuts.