Decision Support
Supported Workflows
Visiopharm provides three modes of execution, depending on the device and laboratory workflow. Refer to the section that corresponds with the laboratory's workflow.
Manual ROI Detection
Follow these steps for manual ROI detection:
- Open relevant image in Visiopharm platform.
- Outline relevant regions in the image.
- Save drawn regions.
- Assign APPs and trigger analysis in the relevant image.
Assisted Manual ROI Detection
Follow these steps for assisted manual ROI detection:
- Open relevant image in Visiopharm platform.
- Outline relevant regions in the image.
- Save drawn regions.
- Assign APPs and trigger analysis in the relevant image.
Automated ROI Detection
There are two possible workflows, depending on the setup of the device:
- If the Digital Pathology workflow is set up to auto-execute the device on relevant images, the image will be pre-analyzed. Please proceed to the "Results Review"-section.
- If the Digital Pathology workflow is not set up to auto-execute the device on relevant images, the image analysis will have to be manually triggered.
Please follow the steps outlined in the following sections if the Digital Pathology setup is not configured to auto-execute the device:
- Open relevant image in Visiopharm platform.
- Assign APPs and trigger analysis in the relevant image.
Open Relevant Image in Visiopharm Platform
Open the relevant image in the Visiopharm Platform through the Digital Pathology workflow (IMS/PACS). Depending on the case/image management system used, this can vary.
Ensure that the image contains the specimen type targeted by the APP.
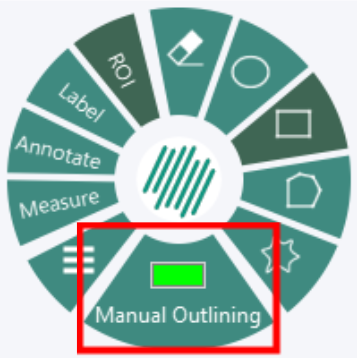
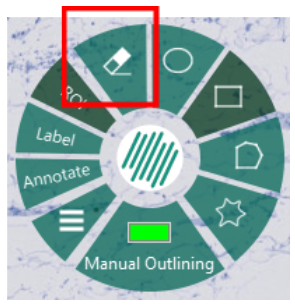
Define the area in which the APP should run. Right-click in the viewer to bring up the wheel menu. Select ROI and ensure that the ROI type is set to Manual Outlining or Default. Then select one of the drawing tools available.
Ensure only to outline the relevant regions targeted by the APP.
To modify or delete drawn ROIs:
- Select the eraser tool and encircle the area to be removed.
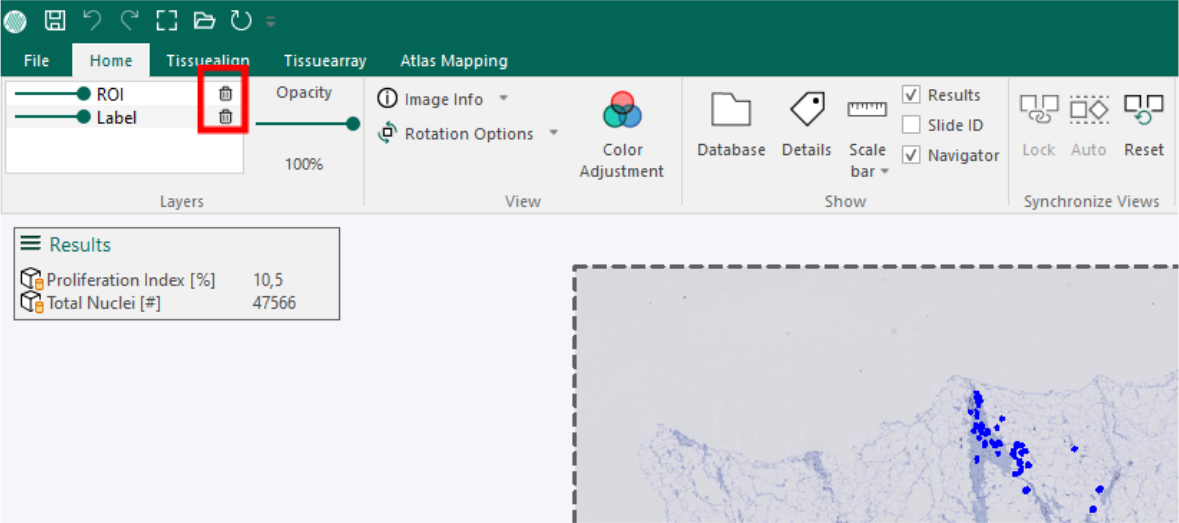
- Alternatively, delete the entire ROI by selecting the Trash can icon in the Ribbon, which will remove all regions on the image.
Save Drawn Regions
Click Save ![]() or press
or press Ctrl + S to save the manual outline.
Assign APPs and Trigger Analysis in the Relevant Image
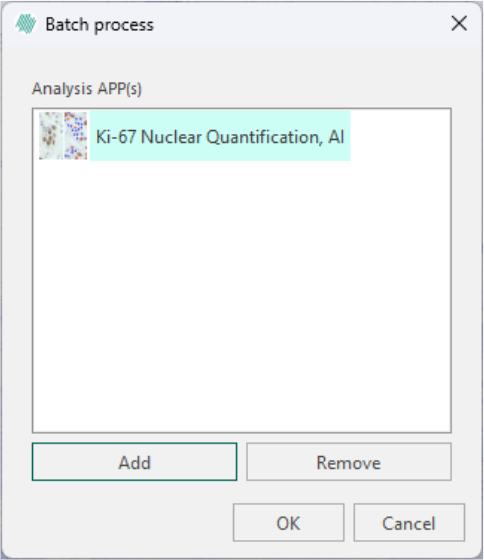
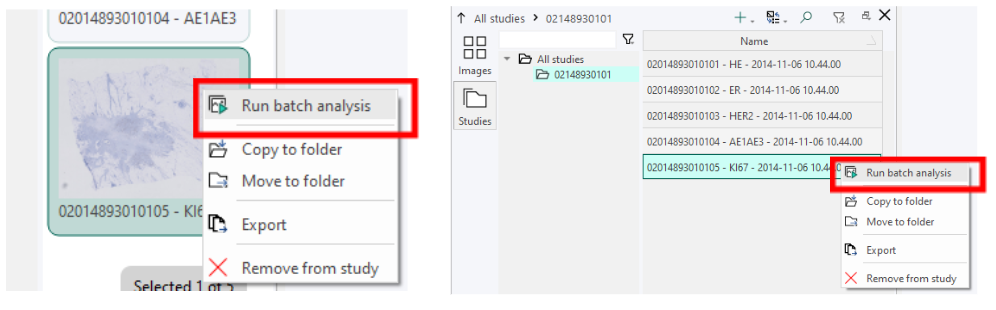
Right-click on the relevant image in the database and select Run batch analysis. The appearance of this option may vary depending on the database layout.
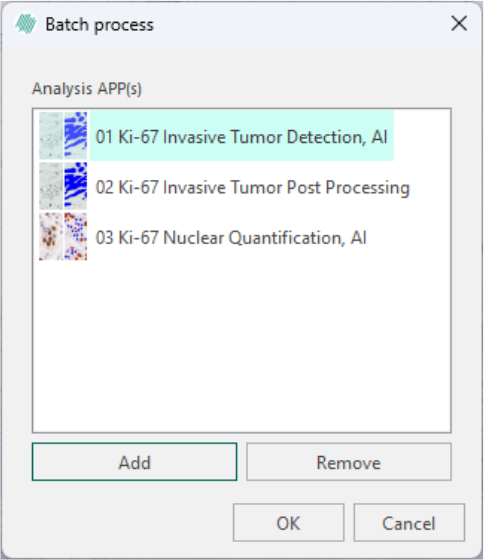
If the relevant APPs do not appear in the Batch processing dialog, click Add to choose the relevant APP(s).
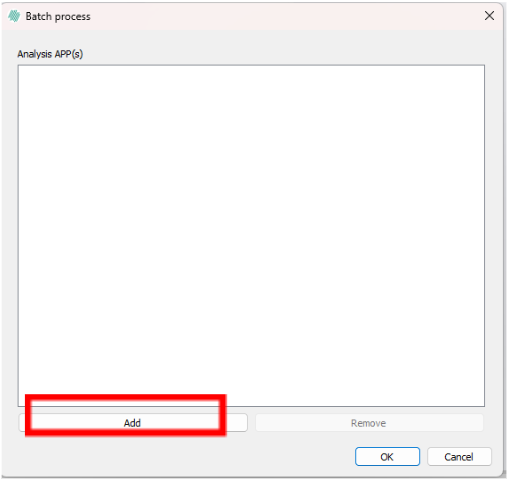
In the dialog, navigate to the relevant APP. Select the relevant APP and click Open to add it to the Batch process dialog.
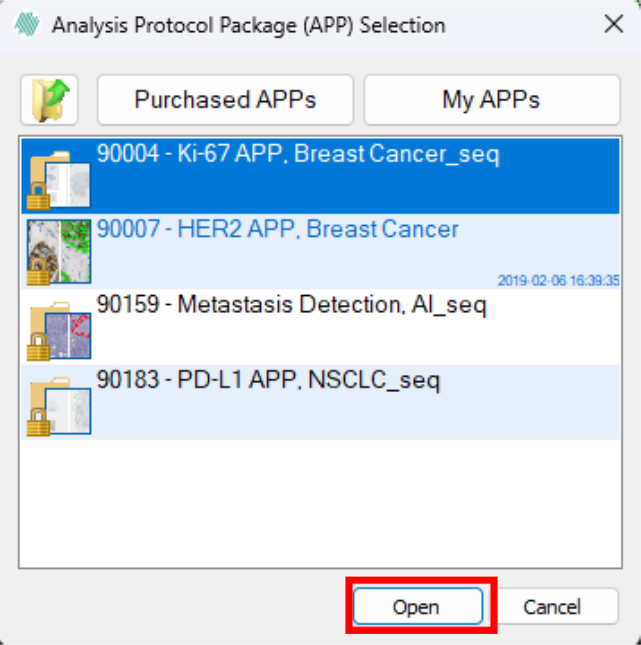
Once the relevant APP(s) is loaded click "OK" to trigger the analysis.
The results will appear automatically in the viewer once the image has been successfully processed.
Review Results
When the analysis is complete, review the results of the APPs in the Visiopharm Platform viewer. Results appear as numbers in the top left corner of the viewer, with labels added to the image to allow inspection of the basis for the numerical results.
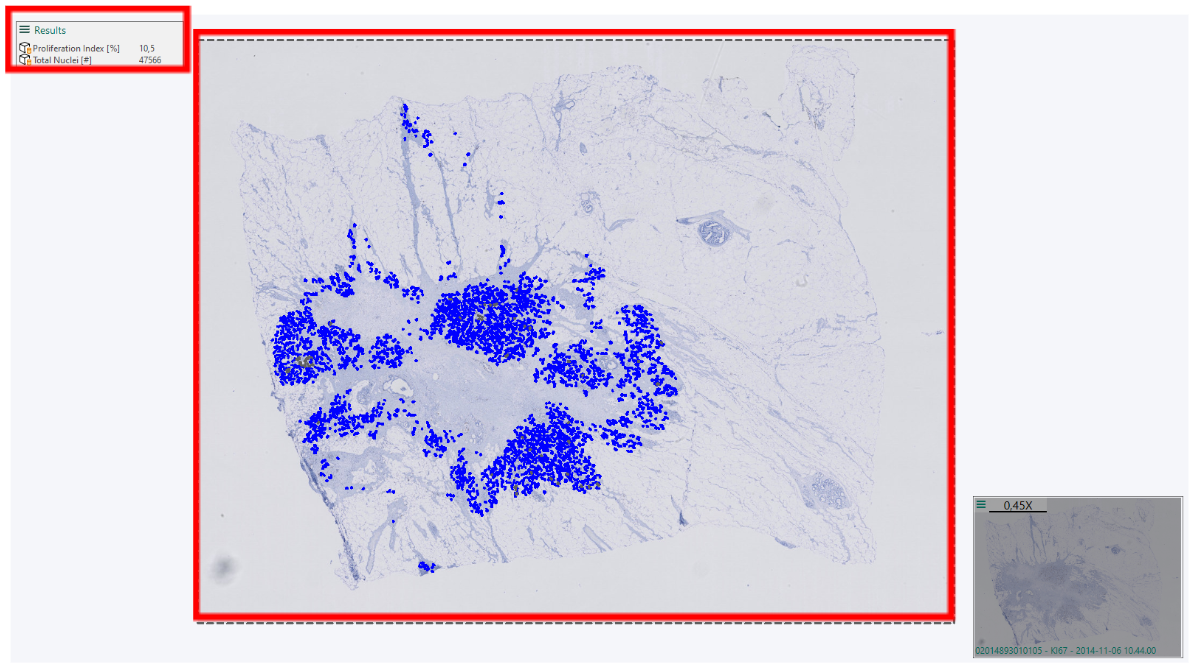
Navigate the image by zooming in and out with the mouse wheel and dragging to move to different locations within the tissue.
Results are presented in the results box:
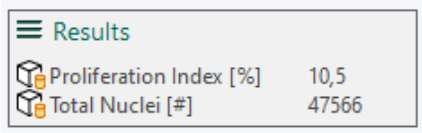
Results shown in the results box can be copied directly. This allows for easy transfer of data to text editors or advanced documentation tools:
Ctrl + CorLeft-clickon and then select Copy this copies all the content from the results as plain text.
Ctrl + Vpastes into plain-text fields or documents without formatting.- Pasting into rich-text or HTML editors will retain plain formatting unless transformed post-paste.
If the copied result contains dataset, the corresponding dataset path will also be shown. If the dataset itself is required, it must be manually exported through the Visiopharm Platform.
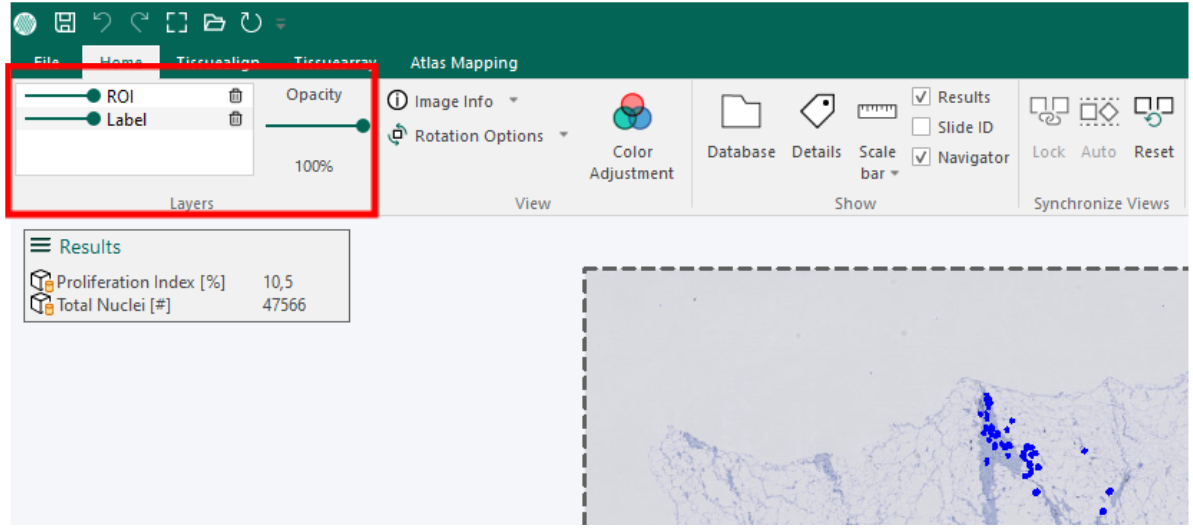
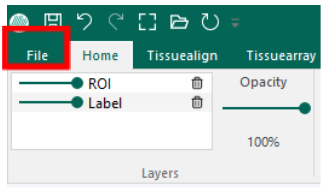
When navigating the image, it may be necessary to turn the labels and regions on and off to see the tissue beneath. This can be done by:
- Panning: panning around in the image. While panning, the overlays are disabled.
- Adjusting the Opacity slider to make regions and labels more transparent. The opacity of each layer can also be controlled individually using the ROI2 or Label sliders.
False Positive/Negative Tissue Detection
Always ensure that the image includes the tissue targeted by the APP.
Refer to the IFU (Instructions for Use) of the specific device for more details on the relevant tissue and specimen targeted by the APP.
For troubleshooting, please contact Visiopharm.
Manual ROI Detection
If running a manual ROI detection workflow, ensure that the relevant tumor regions specified by the APP are correctly outlined. Manually drawn ROIs can be added or edited by following the steps in the section Outline relevant regions in your images.
Once the relevant tumor regions are correctly outlined, proceed by following the steps outlined in the following sections:
- Save Drawn Regions
- Assign APPs and Trigger Analysis in the Relevant Image
Assisted Manual ROI detection
If running an assisted manual ROI detection workflow, ensure that all relevant tissue specified by the APP is correctly outlined. Manually drawn ROIs can be added or edited by following the steps in the section Outline relevant regions in your images.
Once the relevant tissue regions are correctly outlined, proceed by following the steps outlined in the following sections:
- Save Drawn Regions
- Assign APPs and Trigger Analysis in the Relevant Image
False Positive/Negative Tumor Detection
Always ensure that the image includes the tissue targeted by the APP.
Refer to the IFU (Instructions for Use) of the specific device for detailed information on the relevant tissue and specimen targeted by the APP.
For troubleshooting, please contact Visiopharm.
Manual ROI Detection
If running a manual ROI detection workflow, ensure that the relevant tumor regions specified by the APP are correctly outlined. Manually drawn ROIs can be added or edited by following the steps in the section Outline relevant regions in your images.
Once the relevant tumor regions are correctly outlined, proceed by following the steps outlined in the following sections:
- Save Drawn Regions
- Assign APPs and Trigger Analysis in the Relevant Image
Add Your Own Comments
Manual annotations can be added to images to highlight certain areas, measure structures manually, or include comments directly within the image.
Right-click in the viewer to bring up the wheel menu. Select Annotate and then select one of the tools available. All tools include the option to add a user-defined comment:
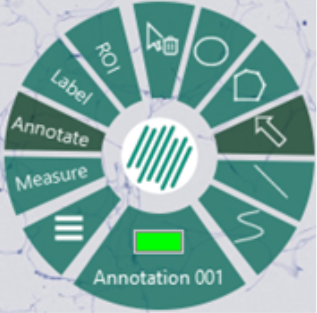
| Option | Description |
|---|---|
| Circle | Measure area and circumference of a circle |
| Polygon | Measure areas and circumference of a structure |
| Arrow | Point to an object |
| Straight Line | Measure direct distance between two points |
| Freehand Line | Measure length of irregular objects |
Save Edits
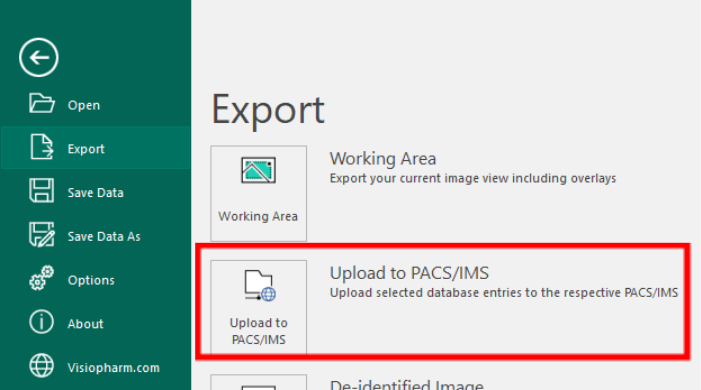
To save any changes made to the images (APPs results, overlays, and manual annotations), go to File → Export.
Click "Upload to PACS/IMS" to upload the changes to your PACS/IMS provider.