New Variable
Variables can be based on data from the original image, feature image, or the classified image. Apart from these, variables can be based on image measurements, error code, analysis protocol name, APP Execution Log and HER2IHC connectivity. The input is chosen from the Input list and, depending on what input is chosen, further options are available. The output level panel in the “Add New Variable” dialog defines the grouping of the output variable. There are three options:
Image
The “Image” Level provides one value for the entire image or region. In the example below, the APP detects and counts Glomeruli (blue outlines) in a kidney section. Here the “Image” level is used to report the Count of objects in the whole image.
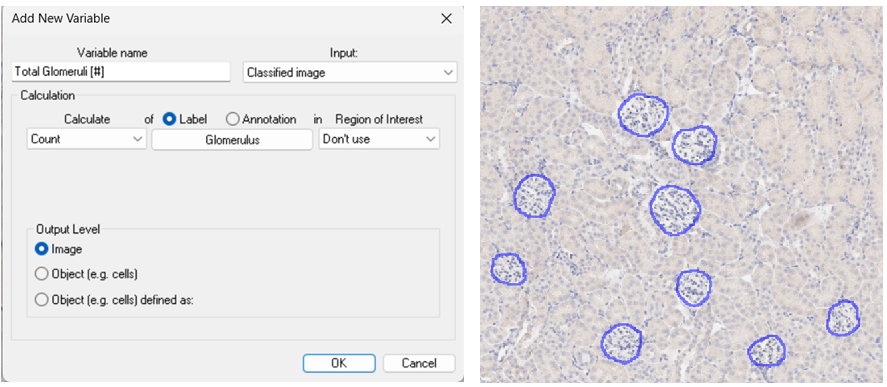
Any situation where a single value per image is required should use this output level, for example the total tissue area, or number of cells in a tissue compartment.
Results are summarised as detailed in the Output Accumulation page.
Object (e.g. cells )
The “Object” Level provides one value per discrete object. This is primarily used for cell analysis, where a distribution of results is required.
In the following example, the DAB (brown) intensity is measured for each cell.
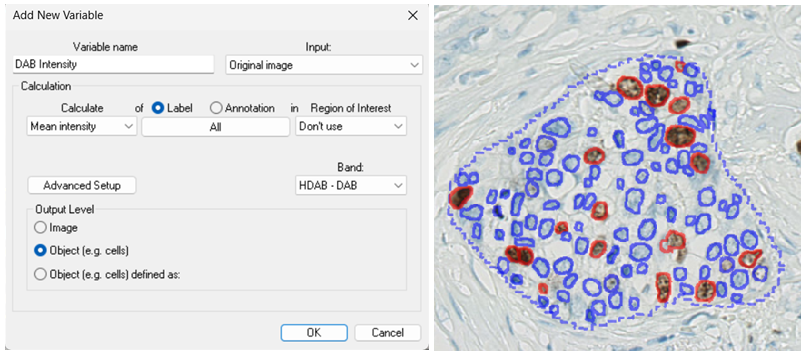
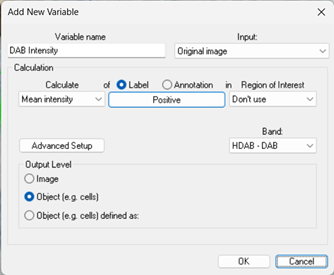
The resulting dataset consists of 117 values (one per cell object). If only a subset of the cells is desired, the specific label can be selected in the Label / Annotation box as shown below.
For simple objects, when per-object outputs are required, this output level should be used. Examples include measuring the area, form factor or intensity distribution per cell.
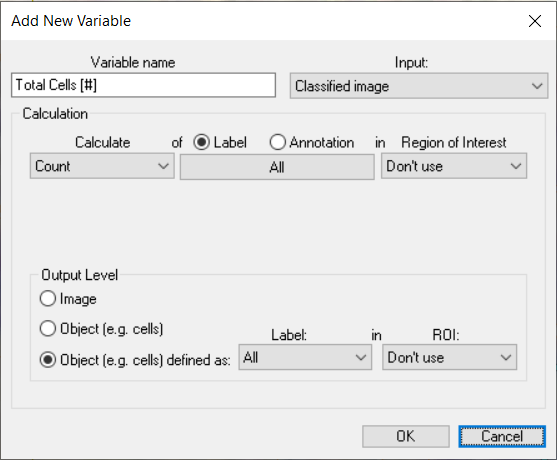
Object (e.g. cells defined as)
The “Object Defined as” output level allows for the specification of a custom grouping of objects. This is particularly useful when objects comprise multiple label types, such as in in situ hybridisation (ISH) analysis.
In the example below, if the “Object” Output Level were used, each different label would be considered a unique object. Using “Object defined as” treats all contiguous labels as a single object.
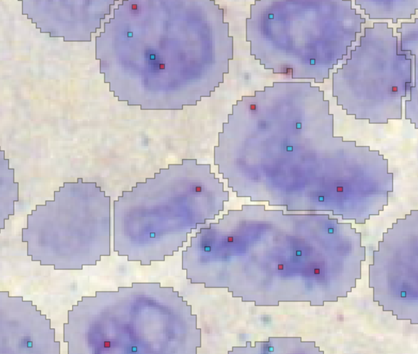
Once the Output Level is defined, specific questions can be asked, for example the following setup will report the number of red spots per composite object.
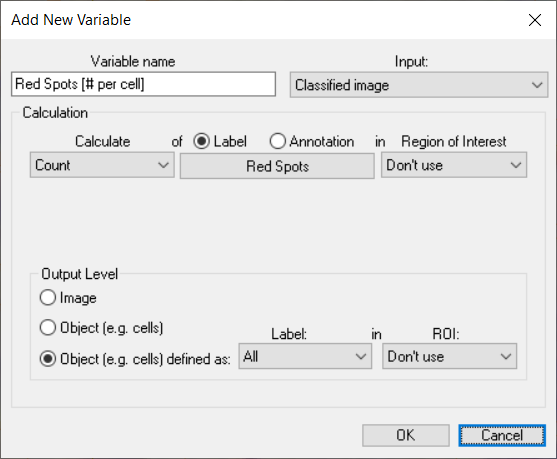
The same procedure can also be used to define objects based on ROIs or collections of contiguous ROIs.