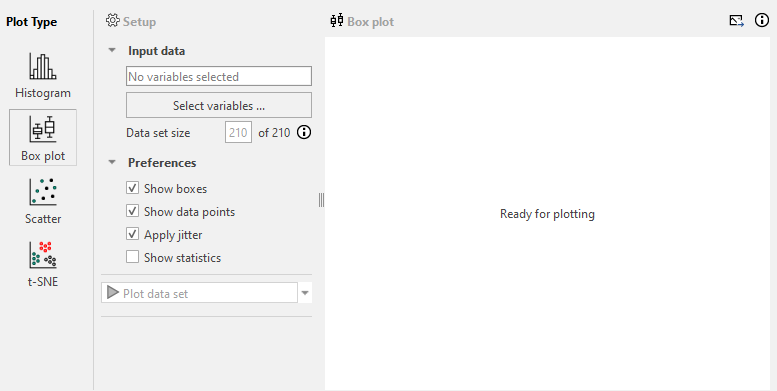
Box plot
The Box plot is an effective way to show the distribution of numerical output variables individually, and should be used to look for outliers or a possible skew in the distribution.
Multiple output variables can also be investigated in individual box plots by selecting more than one output variable in the variable selection of the tool. Box plots are useful for visualizing continuous data where distributions of each variable vary widely between data points.
In the following example, we demonstrate the utilization of a box plot to explore an individual CD68 stained image, upon which an APP for Glomeruli Detection has been executed.
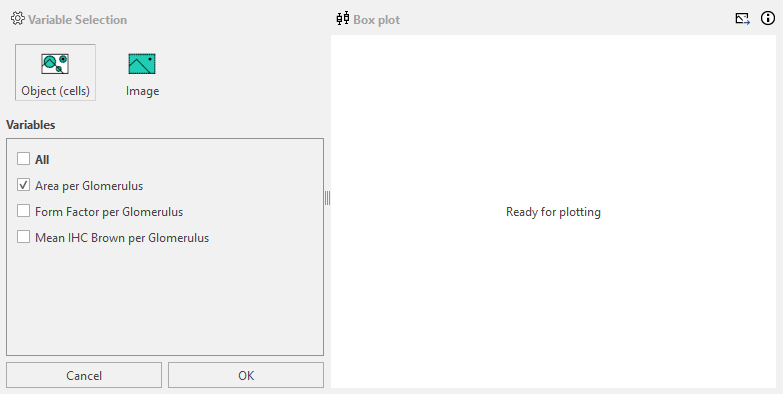
Clicking on "Select Variables..." opens the menu shown below, where we select the variable "Area per Glomerulus", and press "Select Variables".
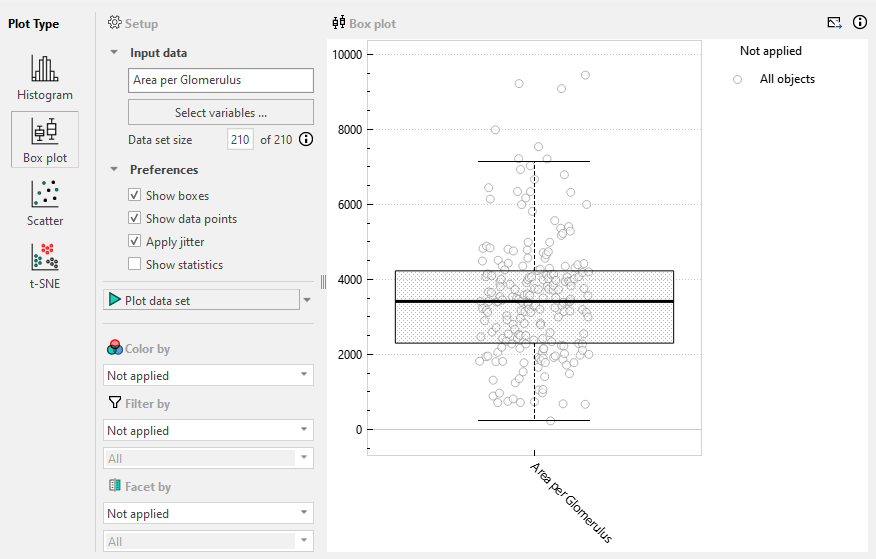
The Preferences for the box plot can now be chosen.
- The "Show boxes" option will show the box plot boxes if ticked, indicating the spread of the data as the minimum
(or Q0), first quartile (Q1), median (Q2), third quartile (Q3), and maximum (Q4).
- The "Show statistics" will display the specific numbers for the quartiles and requires that "Show boxes" is ticked.
- "Show data points" will show or hide the data points depending on if it is ticked.
- "Apply Jitter" will spread the points, making it easier to discern if points are clustered around a specific value. It requires that "Show data points" is ticked.
Plotting the data will result in a plot where potential outliers can be detected. In the boxplot, outliers are seen as points with a vastly different value than most points for a given variable. They are located either at the top or bottom , usually outside the plot’s whiskers.
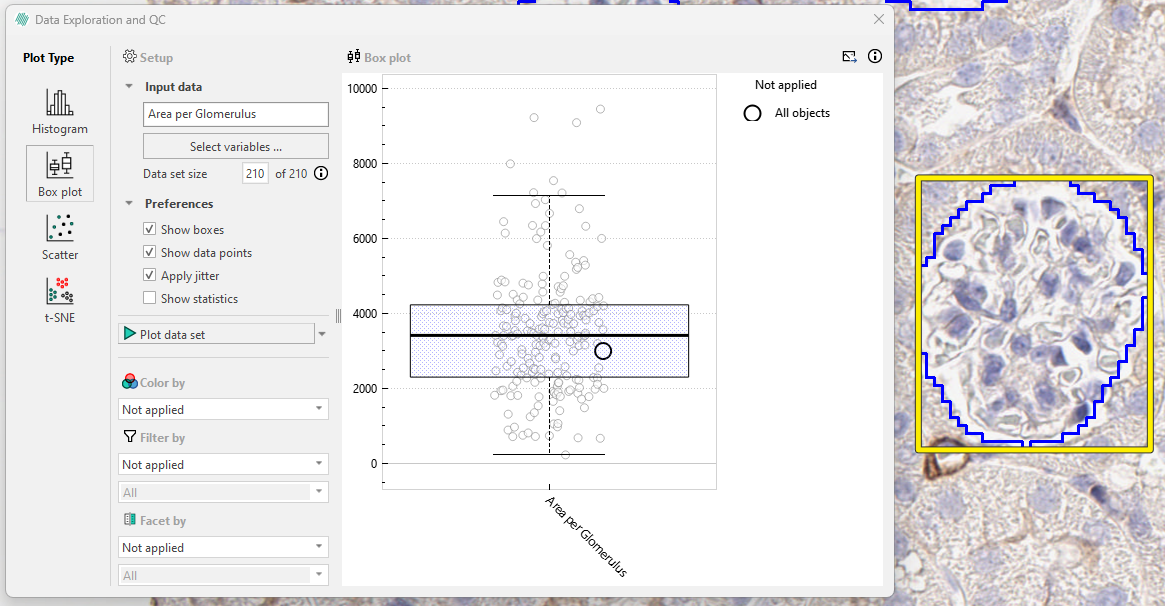
Clicking on a data point in the boxplot will zoom in on the corresponding area, here the specific glomerulus, revealing that it is infact 3 glomeruli. This can be rectified in the APP used to find the glomeruli or the object can be removed from the study entirely by either not importing it into the Exploration tool or deleting it from the database.
Further exploration of other potential outliers can be done by using the "Color by" function. In this case we color by "Form Factor per Glomerulus", where a value of 1 indicates a completely round element, and lower values indicate elongated shapes.
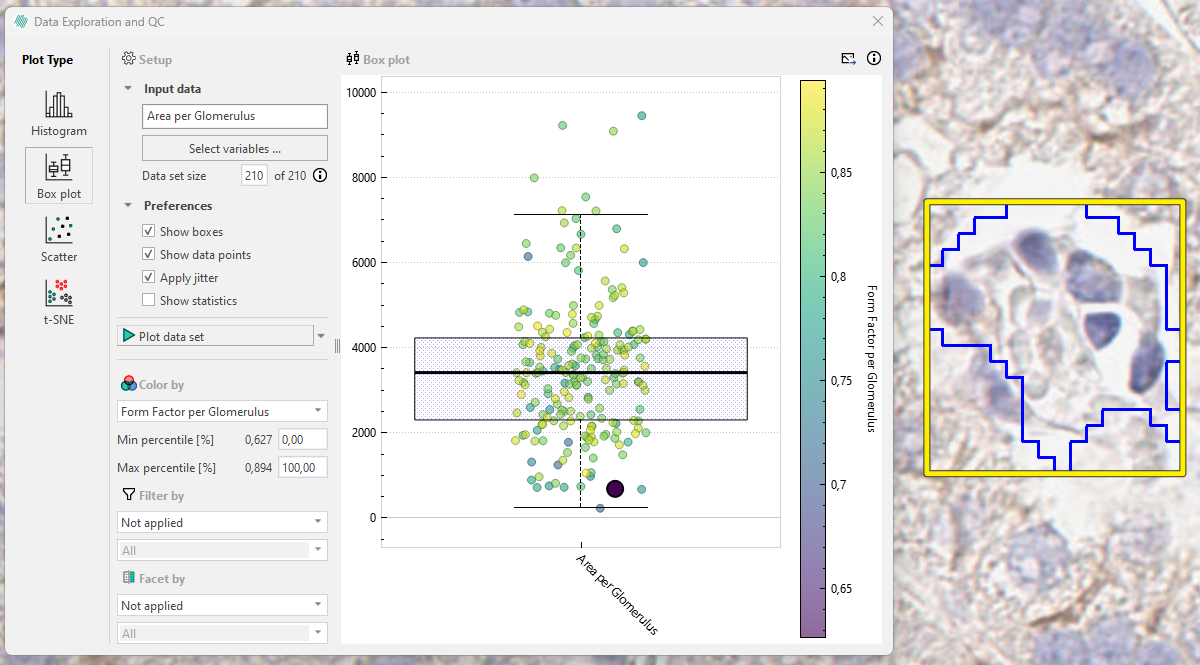
Using this exploratory method, it is possible to find merged glomeruli that are non-obvious when only examining the glomerulus area.