Explore / QC results
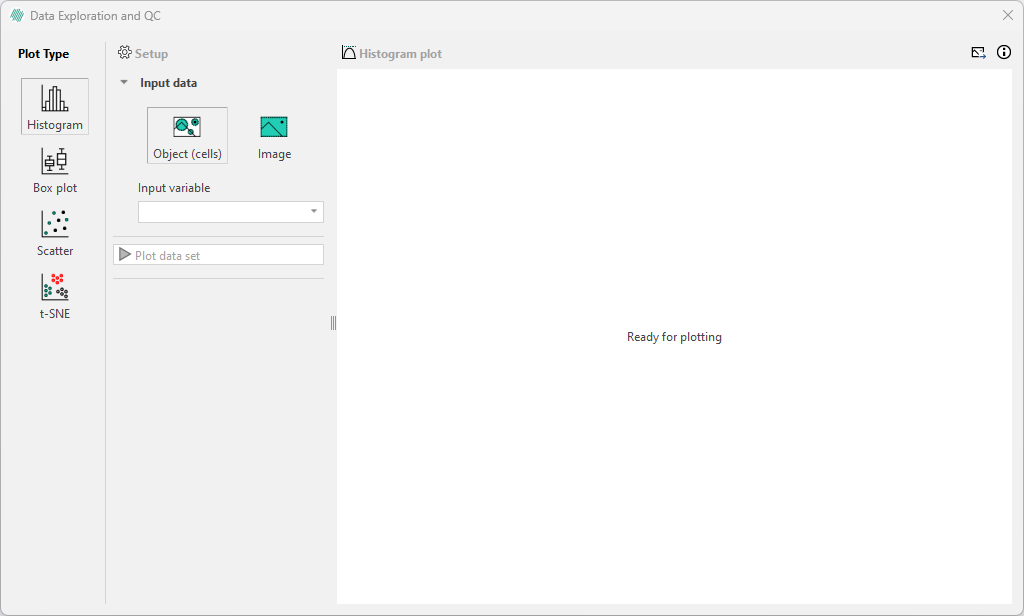
Explore / QC results is an effective Quality Check tool during cell segmentation and phenotyping. It provides interactive plotting tools useful for finding correlations and outliers in the analyzed images.
Initializing the Quality Check is done by selecting desired images or studies in the database and clicking the Explore / QC results button. Note that the selcted images must have been analyzed with an APP with the Object Info Output variable. Additionally, the Output Variables must be saved to the associated images, and that data sets resulting from output variables must have the same number of data points. Please refer to the Object Info article for more info.

Remember the following principles when preparing results for the exploration tool:
-
Only import/select images that have the same APP output variables/columns.
-
Only import/select object-level output variables/columns that have the same object definition (no support for multiple object definitions).
For phenoplex images the premade Nuclei Detection, IMC, AI APP provides a solid starting point for analysis.
Use t-SNE if you want to investigate the combination of more than two output variables at the same time, for example exploring the relationships between multiple features such as staining intensity, shape and morphology.
Scatter plots are valuable tools in cell segmentation and phenotyping for quality assessment. They help analyze signals with known overlap characteristics, like the anticipated positive correlation between CD3 and CD4, or the expected negative correlation between CD4 and CD8.
Box plots and histograms are efficient for identifying outliers in the data and can be employed to adjust the sensitivity of the APP used to generate the data.
Plotting hints
When a plot is created in the plot tool, it is possible to zoom and pan around the plot to inspect specific areas of the plot. By double-clicking anywhere on the plot you can reset the zoom level and plot axes.
Saving a plot is done by clicking on the save icon in the top-right corner. You can save the plot as a BMP, JPG, PNG, or PDF-file. Only the current view of the plot is saved.
To downsample and plot your data set, type in your preferred Data Set size in the box shown below. Please note that a maximum of plottable objects is capped to 300. Downsampling is done as a uniform distribution.
Facet by can be used to split the current plot based on label, ROI, Image name or Folder name in the database or on the name of the import folder. Filter by can be used to exclude data based on any of the above.
If you have added a column of data to the Database, it is possible to use these to Color or Facet by.
For t-SNE plots, Scatter plots, and Box plots, clicking on a data point in the plot tool will highlight and zoom to the corresponding object in tha image in which it is located. Similarly, clicking on an object in an image will highlight the corresponding point in the plot.
Selecting more than one point is currently only available in the t-SNE plot and Scatter Plot. Here, you can select multiple points in one of two ways.
- Hold Ctrl while clicking the desired points. As the points are clicked, they will be added to the selection one by one. You can clear the selection by releasing Ctrl and clicking anywhere within the plot.
- Rectangular selection by holding Ctrl key while dragging the mouse. Any points within the created rectangle will be added to the current selection. Add more points to the selection by using the rectangular approach multiple times. To remove data points from a current selection, use the same rectangular selection. If all the points are already selected, they will be removed from the selection.
To remove all currently selected points, simply click on an unoccupied area of the plot. A maximum of 50 points can be selected at a time.