Define features
In the Classification section the Define feature dialog can be opened by clicking the New Feature button 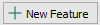 . The steps are shown in the Calculation steps list, and are executed in this order.
- Input frame - choose an image frame to use as a basis for the feature image calculations. The frame may be one of the available frames in the image, or one of the previously calculated feature images.
- Input band - choose an image band in the chosen frame to use as a basis for the feature image calculation. A band may be one of the standard red, green, blue channels, or it may be some other image modality like IHS or other chromaticities. For a more thorough description of the available input bands, see Bands.
- Define input - Used to setup a New color deconvolution input.
- Up - Press to move the currently selected step upwards in the list.
- Down - Press to move the currently selected step downwards in the list.
- New step - Used to define a new processing step for the feature.
- Edit - Edit the currently selected step. Can also be opened by double clicking.
- Delete - Press to delete the currently selected step.
Choose a number of desired steps from the Define feature dialog by adding processing steps.
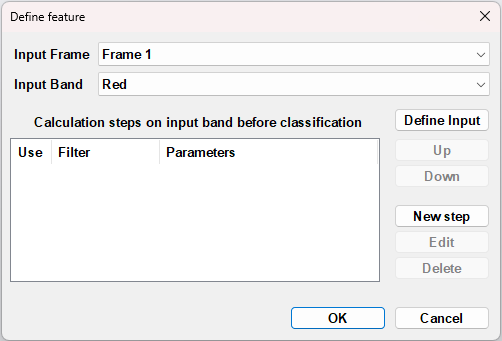
Define Input
Sometimes it might be difficult to get enough separation of colors to successfully complete your analysis by using one of the predefined color deconvolutions. In the Create new color deconvolution input-dialog it is possible to define axis in a color space coordinate system representing the staining (colors). The dialog is opened by pressing Define input in the Define feature dialog.
- Primary stain - defines the primary axis in the color space coordinate system. This is the color that you wish to enhance.
- Secondary stain - defines the secondary axis in the color space coordinate system. This is a color that you wish to suppress.
- Background stain - defines the third axis in the color space coordinate system. If you have none-stained tissue and wish to suppress it you can add the color here.
- Input band name -defines the name of the custom made color band.
You can choose a predefined color from the drop-down list:
| Color | R | G | B |
|---|---|---|---|
| Haematoxylin | 0.074510 | 0.054902 | 0.337255 |
| EOSIN | 0.686275 | 0.019608 | 0.317647 |
| DAB | 0.341176 | 0.101961 | 0.043137 |
| AEC | 0.329411 | 0.066667 | 0.062745 |
| Fast Red | 0.423529 | 0.031373 | 0.145098 |
| Fast Blue | 0.047059 | 0.086275 | 0.341176 |
| Alcian Blue | 0.031373 | 0.155853 | 0.529412 |
| PAS | 0.494118 | 0.019608 | 0.537255 |
| Methyl Green | 0.019608 | 0.556863 | 0.584314 |
| Crystal Green | 0.023529 | 0.356863 | 0.349020 |
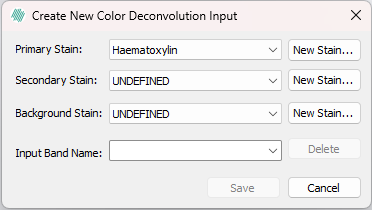
Otherwise you can make a custom color stain by selecting New Stain.
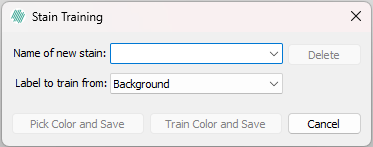
- Name of New stain - defines the name of the custom made stain color.
- Delete - deletes a stored stain color.
- Pick Color and Save - choose a color from a colormap.
- Train Color and Save - choose a color by training it from the picture. This is done by marking the color with a label, and then selected the appropriate label is used to train.
Feature Image
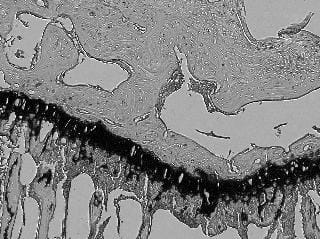
A feature image is used during image processing. The feature image is, as its name proposes, an image that holds image frames which accentuate certain features in the original image. This is used e.g. in the segmentation of images. The feature image is used to distinguish the objects to be segmented from the background of the image. Some objects in color images can be distinct from the background simply by the red, green, and blue color bands, and in this case the feature image holds these bands as separate features. In other cases, prior knowledge of object properties is necessary, and a filtration of one or more bands is the usable feature. Thus the feature image should hold the filtered image band(s).
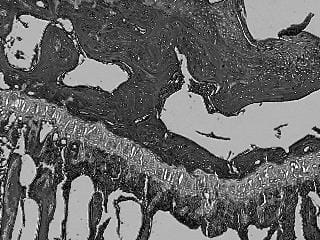
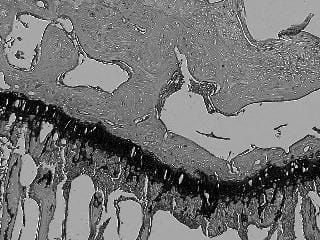
To show a feature, open APP Author and use the Eye icons in the Feature list to show a feature from the list. Below is an example with a HE-stained tissue section, where the dark cells or nuclei which are small rounded (or elliptical) objects should be accentuated. Four usable features for this purpose are shown: red band, green band, blue band and a blob filtration (2. eigenvalue filter) of the red band.
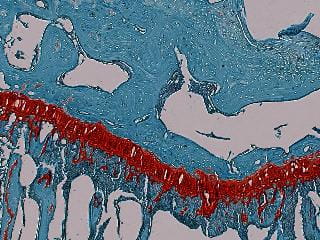
Left: Feature 1 - Red band, Right: Feature 2 - Green band (both knee section, LT slice).
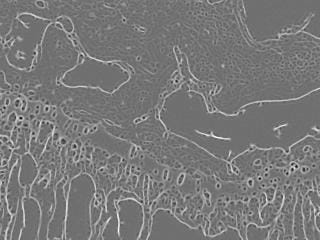
Left: Feature 3 - Blue band, Right: Feature 4 - Red band local linear filtrated (both knee section, LT slice).