Phenotype
The phenotyping algorithm uses a two-layered clustering algorithm using the euclidean distance in the band space as clustering measure. The first clustering layer roughly separates/clusters cells into main groups where further separation in subgroups (phenotypes) is provided by the second layer clustering. For instance, the algorithm may cluster immune cells into the same main group with two sub-phenotypes for cytotoxic T-cells and helper T-cells. For high parameter images it might be more prudent to refer to the phenoplex workflow.
Ensure that cells within a ROI are be segmented i.e. the cell objects to include in the automatic phenotyping should be labeled and the labelling should be saved. This can be done manually or by using an APP.
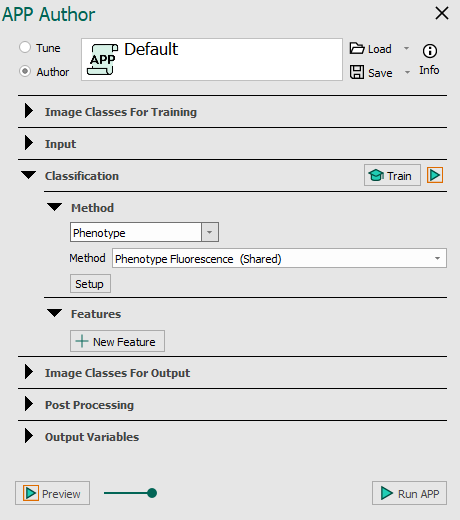
Two different methods are available, Phenotype Fluorescence (Shared) and Phenotype IMC (Shared). The method should be selected based on the staining of the tissue slide and the systems involved. If the fluorescence data stems from PE Vectra or Polaris systems, Phenotype Fluorescence (Shared) should be selected and if the Fluorescence data stems from the Fluidigm Hyperion system, Phenotype IMC (Shared) should be selected.
Clicking Setup will open the Channel Contribution Setup, which allows for adjustments of the per pixel value input to the automatic calculation of the per object mean value which is the input for the phenotype classifier. If adjustments need to be made it either includes or excludes objects. In this dialog, options regarding which pixels the mean is calculated from are available for each channel/band in the image.
| Option | Description |
|---|---|
| Value range | The value range allows for defining the per pixel value range that will effectively contribute to the calculation of the per object mean value (the input for image classes for output classification algorithm). The low value range input (left) defines a cut-off value by which all pixel values below will be regarded as 0. The upper value range input (right) defines a cut-off value by which all pixel values above will be set to (max value clamping). When no values are entered the data will be treated as raw data (preferable). |
| Quantile range | This quantile range allows disregarding all pixels values outside the range specified by the upper and lower quantile limit. |
| Noise reduction | Enabling the Noise reduction option will run a 3x3 median filter on the pixels. The noise reduction will happen before the value range and quantile range are calculated. |
Adjustments should be made in the following order:
- Change the Quantile range.
- If this is not enough to separate positive and negative cells use the Value range to either reduce the contribution of low signal pixel values and/or reduce the contribution of high value pixels. Avoid the use of Noise reduction when it is not needed (and in case of low positive signal values) as it reduces the applicability of the use of quantiles, which makes it harder to separate noise from signal.
The APP can be trained by pressing the ![]() Train button. Like other classifiers, training from multiple images is supported. The APP uses all labels, no matter type, currently present in all images for the training.
Train button. Like other classifiers, training from multiple images is supported. The APP uses all labels, no matter type, currently present in all images for the training.
Click Run APP to run the classification on the ROIs selected in the Regions To Analyze subsection in the Input section.
If you're experiencing issues with Phenotype, contact support@visiopharm.com