Phenoplex
Phenoplex provides several methods for identifying all cells within the tissue, including the Phenoplex Guided Workflow, Semi-automated Phenoplexing, and Manual Phenoplexing.
Visualize data using the built-in tools for a comprehensive overview. Phenoplex combines graphs and t-SNE plots with recolored image views to better confirm the phenotyping results. All graphical interfaces are interactive and all plots can be adjusted to display each tissue compartment, phenotype, biomarker, or cell.
At any point when using Phenoplex, changes can be undone by selecting the ![]() button or pressing
button or pressing Ctrl + Z. Similarly, undone changes can be redone by selecting the ![]() button or pressing
button or pressing Ctrl + Y.
To access Phenoplex, ensure that the selected images have associated Object Info saved and at least one Multiplex variable output for phenotyping labels.
If these requirements are met, click the button in the Ribbon. Otherwise, refer to the Object Info article.
The database remains accessible, and images can be switched while Phenoplex is loading.
Upon launching Phenoplex Guided Workflow, a menu like the one seen below will be displayed.
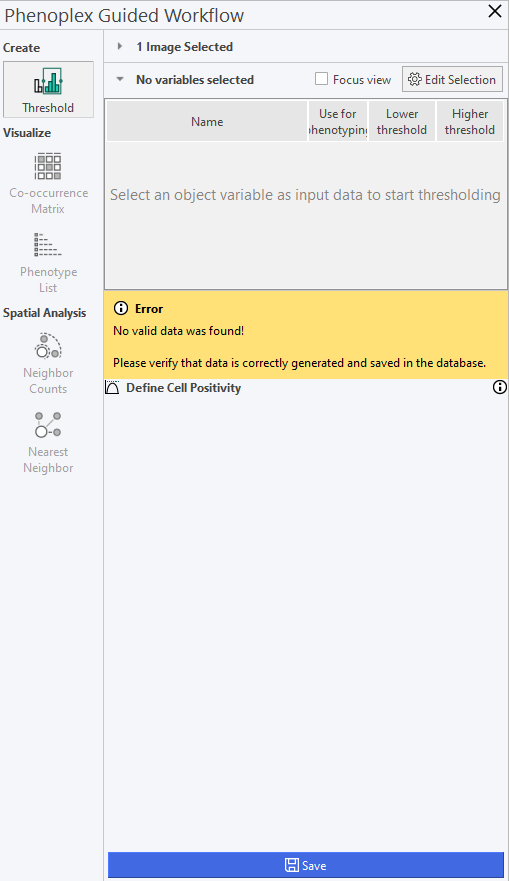
The menu contains the following options:
| Menu | Description |
|---|---|
| Threshold | Select the variables for analysis with Phenoplex. |
| Co-occurrence Matrix | Overview of the selected variables and where they occur in which numbers. |
| Phenotype List | Overview of the selected variables and their co-occurrences. |
| Neighbor Counts | Quantify the number of neighboring cells for each phenotype |
| Nearest Neighbor | Find the nearest neighboring cells for each phenotype within a specified distance |