Feature Based
The feature based post processing step is used to mark areas of interest based on a created image feature e.g., an object heatmap. To create a heatmap follow the steps detailed in the section Heatmaps.
Mark Local Maxima
This step will find local maxima of a chosen label and mark these with another chosen label.
| Option | Description |
|---|---|
| Label | Choose a label in which to search for local maxima. |
| Mark with | Choose the label to use for marking the local maxima. |
| Feature | Choose which feature image the local maxima should be found in. |
| Threshold | Select a threshold for intensity values that should be excluded from the analysis. For example, if a value of 200 is set, the Mark Local Maxima step will ignore any local maxima below 200, even if they otherwise meet the criteria for being a local maximum. |
Mark Max Intensity Areas
This step will find max intensity areas of a chosen feature e.g. an object heatmap and mark these with a ROI. There are four different methods for detecting max intensity areas. Some configuration parameters are shared across all methods, others are specific to the selected method. The shared configuration parameters are:
| Option | Description |
|---|---|
| Input Feature | Choose a feature, e.g., an object heatmap, in which to search for max intensity areas. |
| Marking ROI | Select the ROI, e.g., ROI 003, that should be used to mark max intensity areas. |
| Max ROIs | Choose the maximum number of max intensity areas that can be marked with a ROI. |
| Protected ROIs | Since each pixel can only belong to one ROI, this parameter allows exclusion of selected ROIs from the postprocessing step. The selected ROIs will then not be overwritten by ROIs created during the Mark Max Intensity Areas step. |
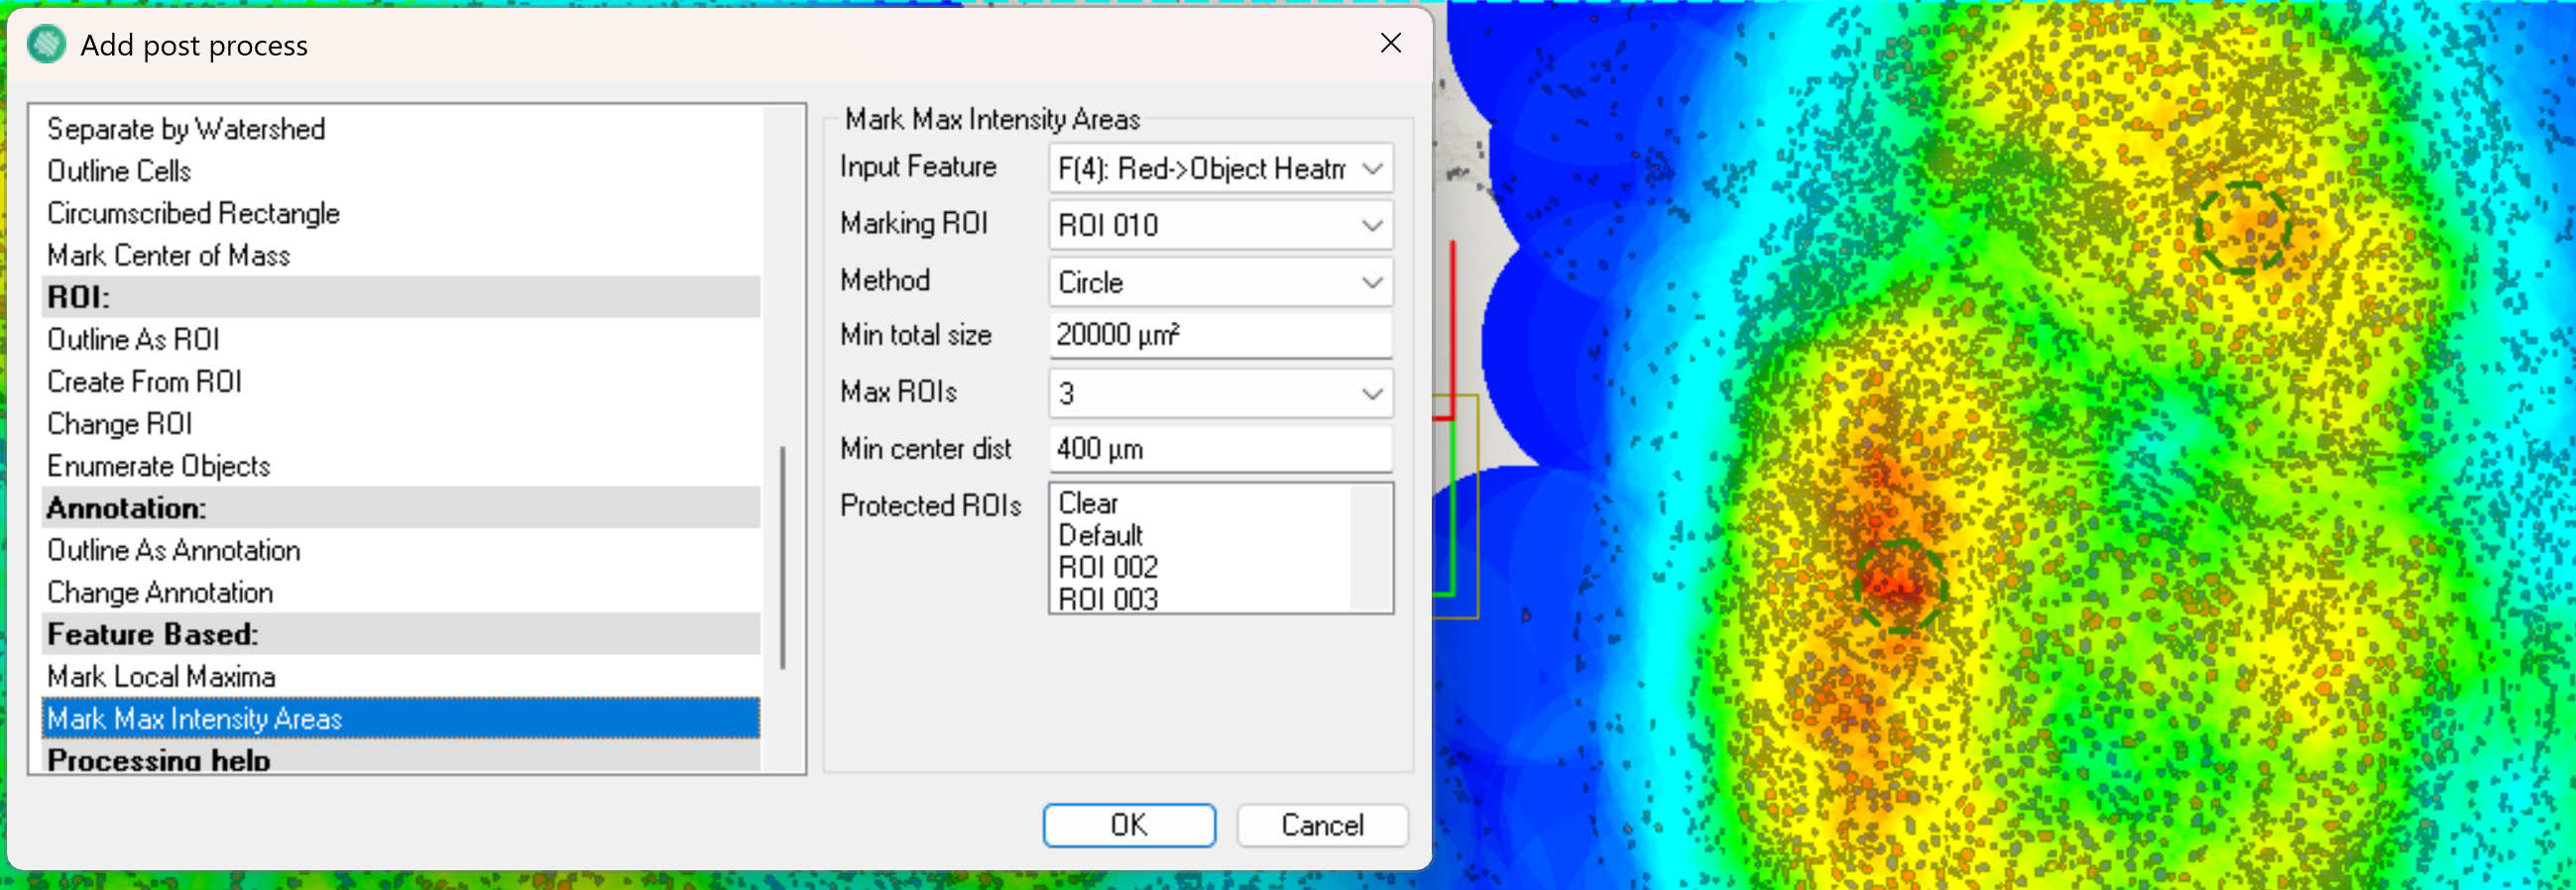
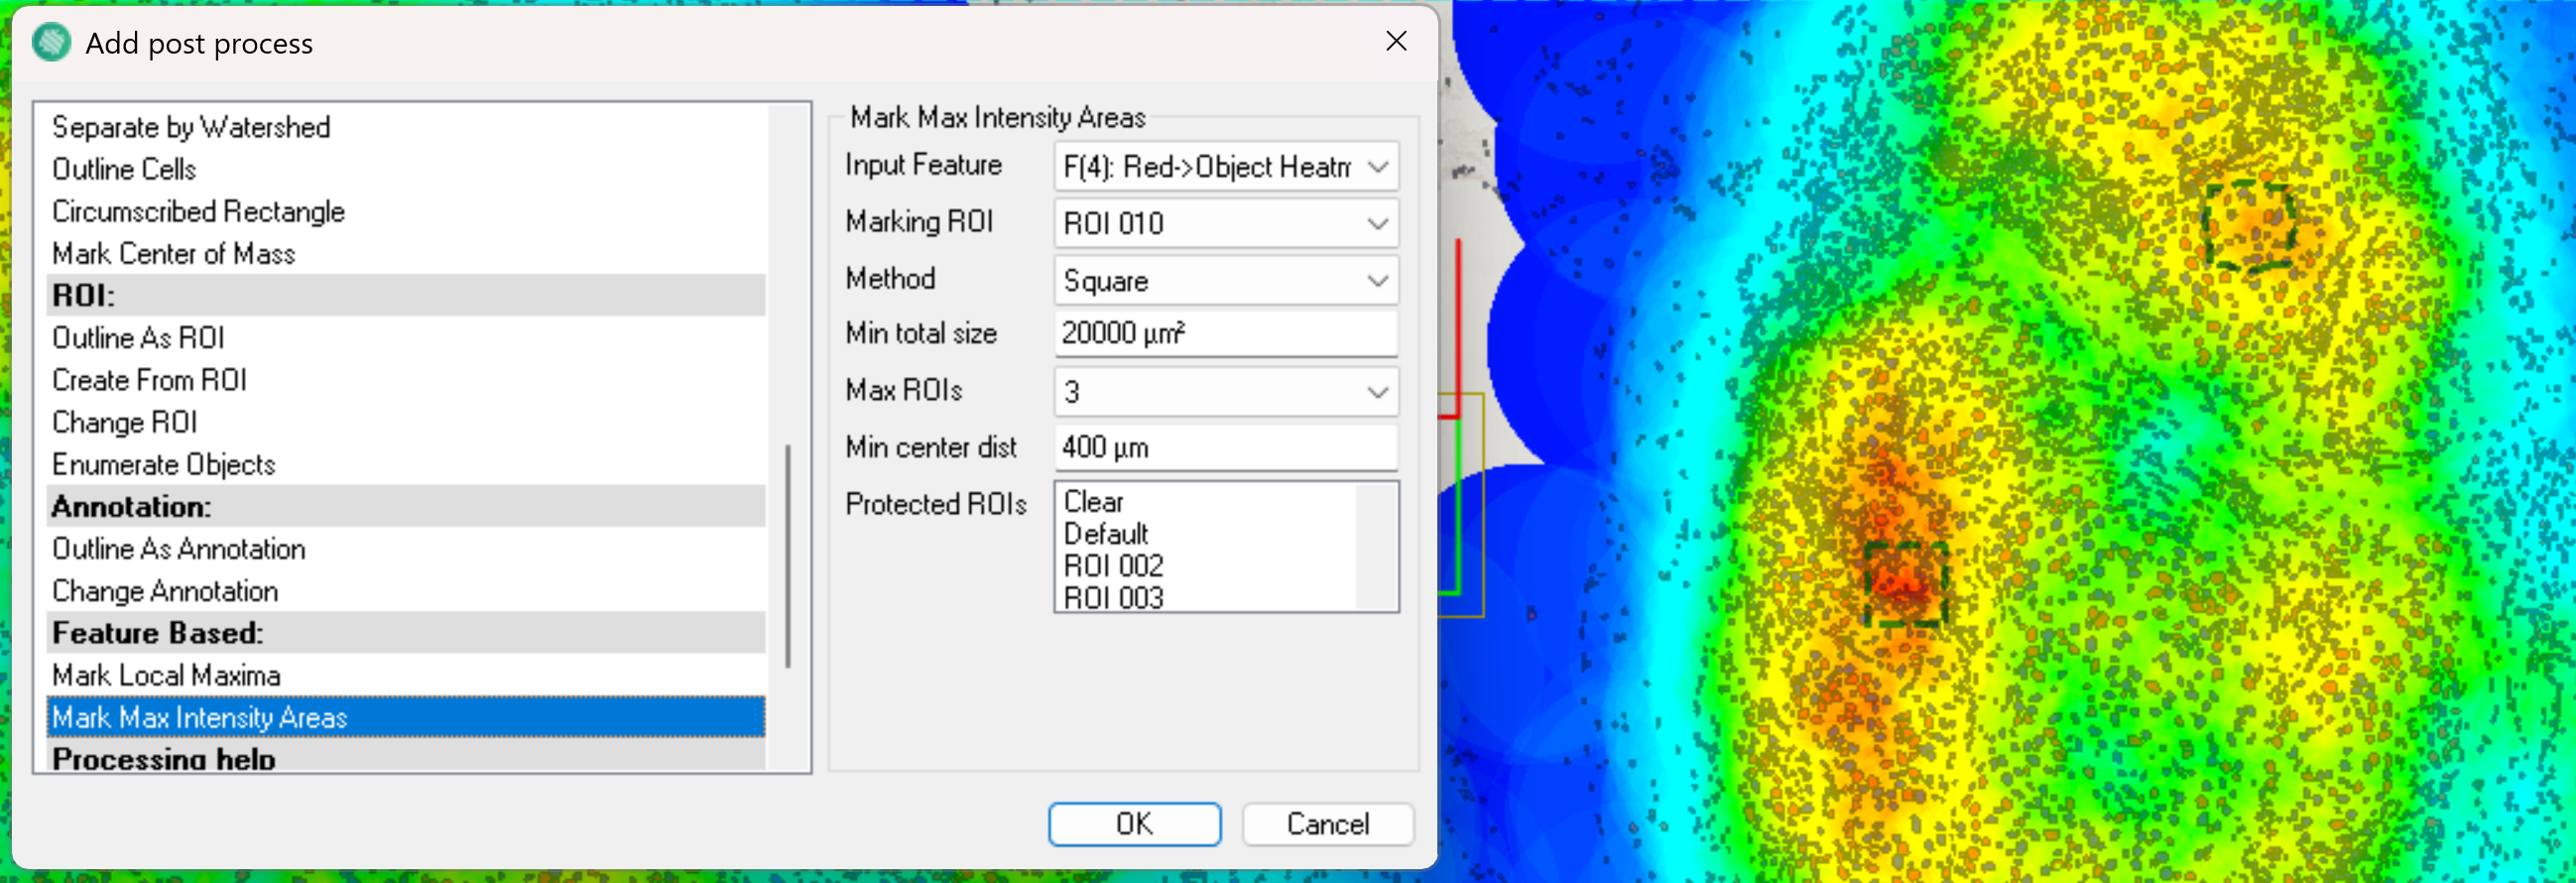
Circle and Square
The Circle and Square method marks max intensity areas with a circle or square shaped ROI respectivly. The ROI then expands in the circle or square shape until the Min Total Size is reached.
The circular method corresponds to looking through a microscope, and thus most closely matches current guidelines for hot spot estimation. When working with a circular hot spot, the drawing radius of the heatmap should correspond to the radius of the hot spot to ensure that the cells contributing to a high value in the heatmap are counted in the found hot spot. It is also possible to choose the Square method, in this case a square is used to mark max intensity areas instead. The method specific parameters for the Circle and Square methods are:
| Option | Description |
|---|---|
| Min Total Size | Choose the minimum combined area of all max intensity areas. |
| Min Center Dist | Choose the minimum allowed distance between the centers of two detected max intensity areas. This ensures that the detected max intensity areas are sufficiently spaced apart. It is only possible to adjust the Min Center Dist parameter when the Max ROIs parameter is set to 2 or more, since at least two max intensity areas are required to define a minimum distance between them. |
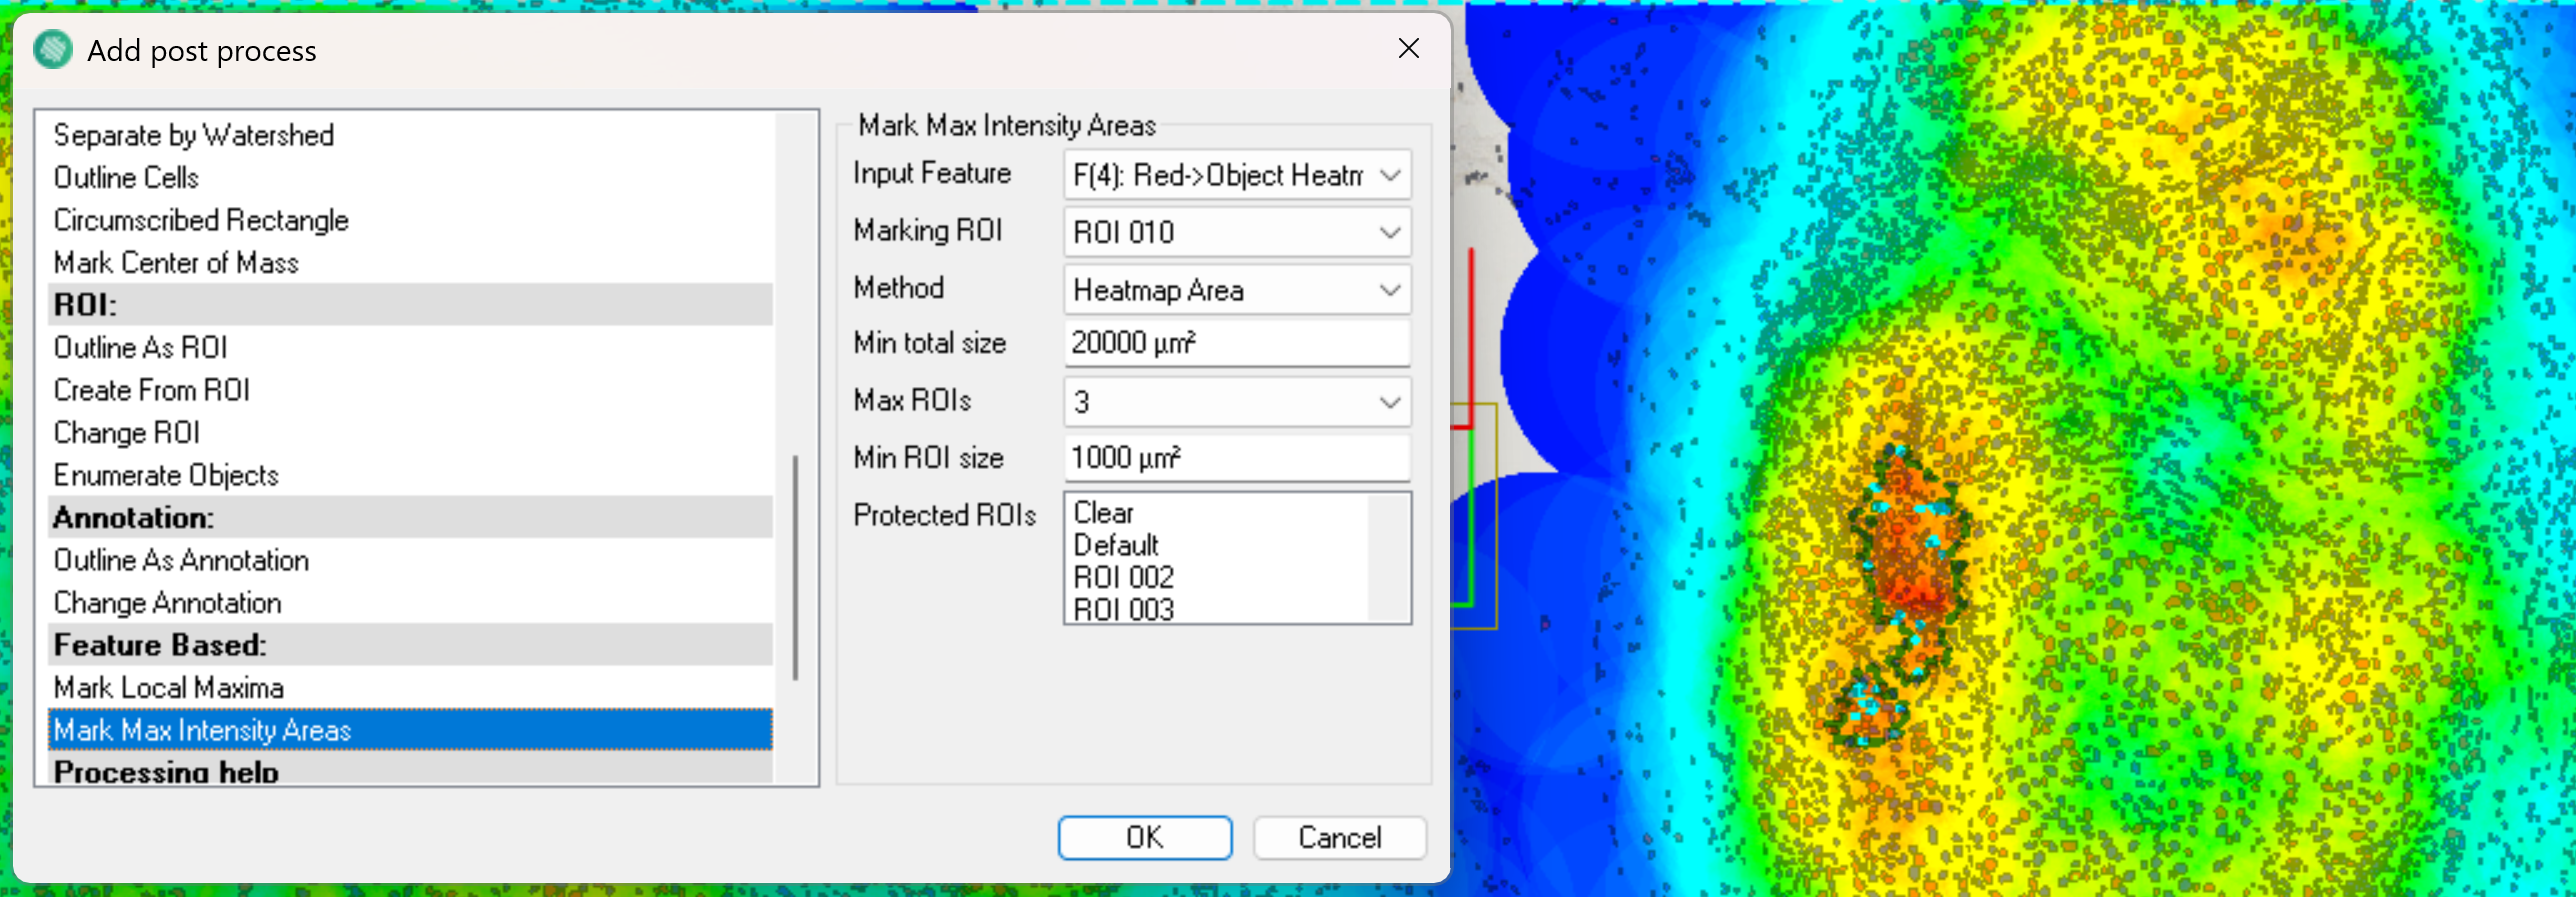
Heatmap Area
The Heatmap Area method marks max intensity areas with a ROI that follows the intensity of the feature. A ROI is drawn by selecting a max intensity pixel, after which the ROI is expanded in the direction of decreasing intensity until the Min Total Size is reached. In general, when using the heatmap shaped hot spots, a smaller drawing radius should be used for heatmap. This is to avoid having cells from far away contribute to hot spots, and then not be included in the found hot spot because they were outside the hottest contours of the heatmap.
| Option | Description |
|---|---|
| Min Total Size | Choose the minimum combined area of all max intensity areas. |
| Min ROI Size | Defines the minimum area of each individual max intensity area. If an ROI marks a max intensity area but the ROIs area is below the Min ROI Size, the ROI will increase by following the intensity until the area is at least the Min ROI Size. |
Heatmap Count
The Heatmap Count method marks max intensity areas based on the count of specific object labels. It is often used after applying a heatmap feature, e.g. a heatmap over classified nuclei. In this case, each nucleus contributes to the heatmap by spreading intensity within a defined radius. The count at each pixel then reflects how many of these radii overlap. The Heatmap Count method then draws ROIs around regions with the highest number of overlaps.
| Option | Description |
|---|---|
| Min Total Size | Choose the minimum combined number of objects inside all max intensity areas. |
| Objects | Choose the object label to use for Heatmap Count e.g. number of nuclei ("Label001"). |
