Manual Phenoplexing
Manual Phenoplexing provides complete control over the phenotyping process. This method is suited for users who require detailed oversight and customization of their analysis. This approach allows for precise adjustments and validations at each step.
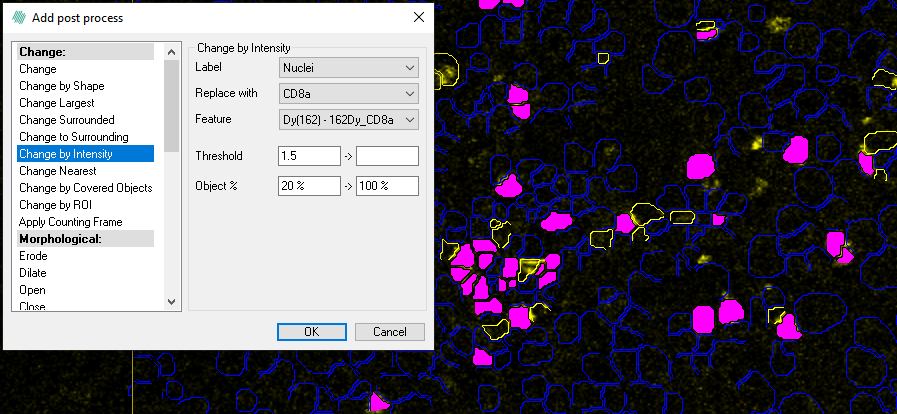
Phenoplexing can also be implemented by using the Post-processing step by setting a threshold.
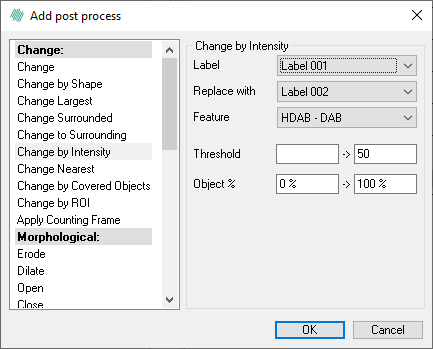
The Change by intensity step will change a given label according to the average of the underlying intensity covered by the label segment. The processing step has five input parameters:
- Label - Defines the label which the step should alter.
- Replace with - Choose which label to replace the current label with. It is possible to choose Clear, to have no label in the areas.
- Feature - Defines the color band or designed feature on which the post processing step is performed.
- Threshold - Defines the threshold range at which the label is changed/not changed. The values between the threshold values are the ones which are replaced. To include all values towards either infinity or minus infinity, simply leave one of the upper or lower fields empty respectively (not zero, but completely blank).
- Percent of Object - Defines the label pixel range, which is used to calculate the mean. This mean is then used for thresholding. Setting the lower Percent of Object value to 10% means that the 10% darkest pixel values in the label are not used to calculate the mean. Likewise, an upper value of 80% etc, means that the brightest 20% pixel values are not used to calculate the mean.
Workflow example
In this workflow example we will examine the two markers CD8a and CD3.
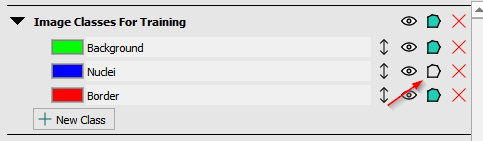
- Firstly click the green polygons to only show the outline of the cell label. This will make it easier to examine whether the post processing steps have made correct detections.
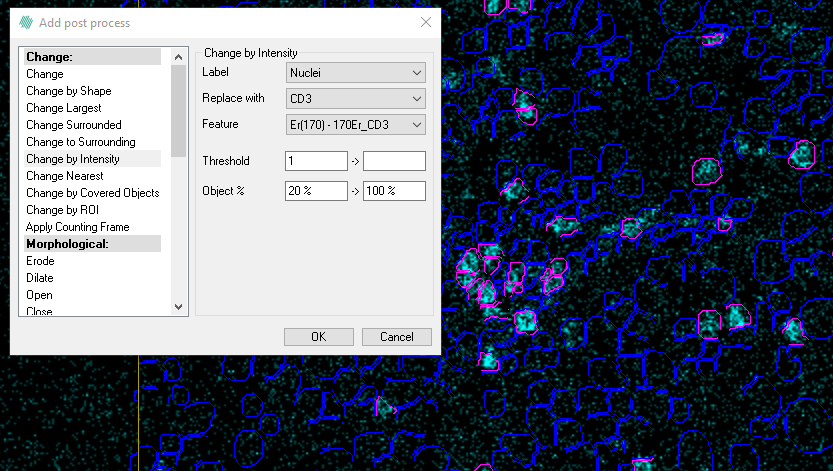
- In the first post processing step we will detect cells that are positive for CD3. We change the Nuclei labels CD3 if the mean intensity is more than 1 and exclude the 20% darkest pixels. In this example the pink cells are positive for CD3.
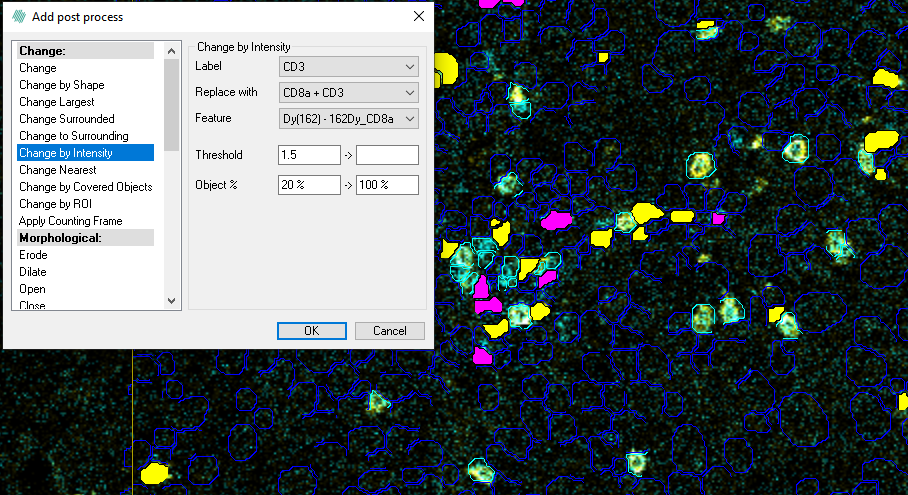
- We will then add another post processing step to find cells that are positive for CD8a. Here we mark Nuclei that have a mean intensity more than 1.5 and exclude the 20% darkest pixels. In this example the yellow cells are positive for CD8a.
- With another post processing step, we find the cells that are positive for both CD3 and CD8a. This time we choose CD3 as the label instead of the Nuclei and check whether these cells are positive for CD8a. Now the magenta cells are positive for CD3 and CD8a.