Phenoplex
Phenoplex offers several methods to identify all the cells in the tissue. You can use the Phenoplex Guided Workflow, Semi-automated Phenoplexing or Manual Phenoplexing.
Visualize your data with the built-in tools for a better overview. Phenoplex combines graphs and t-SNE plots with recolored image views to better confirm the phenotyping results. All graphical interfaces are interactive and all plots can be adjusted to display each tissue compartment, phenotype, biomarker, or cell.
At any time when using Phenoplex you can undo a change by pressing the ![]() button or by pressing Ctrl + Z. Undone changes can be redone by pressing the
button or by pressing Ctrl + Z. Undone changes can be redone by pressing the ![]() button or by pressing Ctrl + Y.
button or by pressing Ctrl + Y.
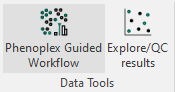
To access Phenoplex, make sure that your selected images have as associated Object info saved and at least one Multiplex variable output for the labels to phenotype on. If this is the case, you can click on the button in the Ribbon. If not please refer to the Object Info article.
Upon launching Phenoplex Guided Workflow, a menu like the one seen below will be displayed.
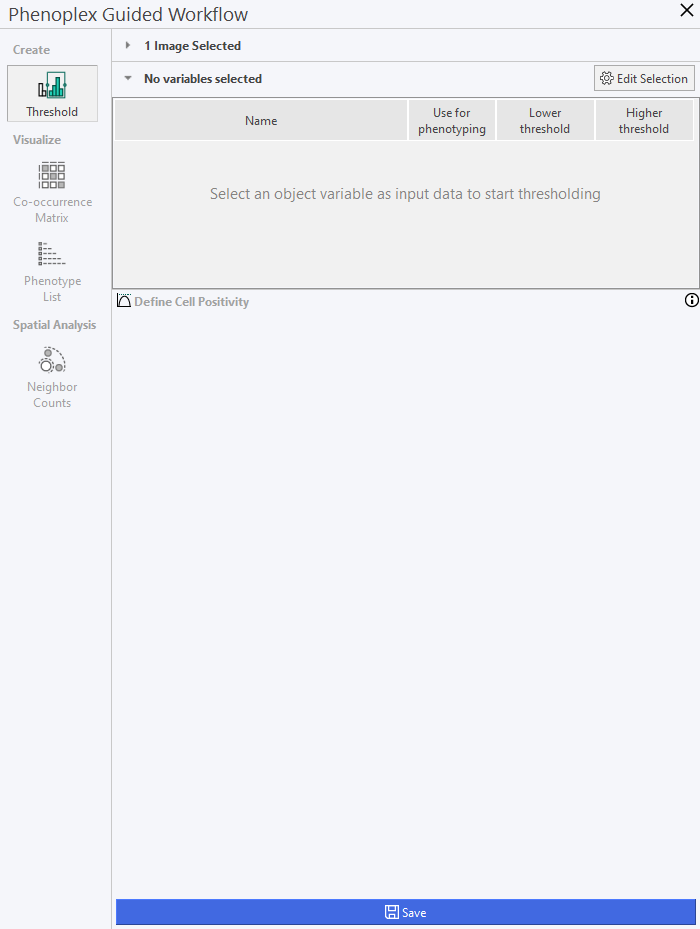
The menu contains the following options:
| Menu | Description |
|---|---|
| Threshold | Select the variables you wish to analyze with Phenoplex. |
| Co-occurrence Matrix | Overview of the selected variables and where they occur in which numbers. |
| Phenotype List | Overview of the selected variables and their co-occurrences. |
| Neighbor Counts | Quantify the number of neighboring cells for each phenotype |