Phenoplex
Phenoplex offers several methods to identify all the cells in the tissue
Visualize your data with the built-in tools for a better overview. Phenoplex combines graphs and t-SNE plots with recolored image views to better confirm the phenotyping results. All graphical interfaces are interactive and all plots can be adjusted to display each tissue compartment, phenotype, biomarker, or cell.
At any time when using Phenoplex you can undo a change by pressing the ![]() button or by pressing Ctrl + Z. Undone changes can be redone by pressing
the
button or by pressing Ctrl + Z. Undone changes can be redone by pressing
the ![]() button or by pressing Ctrl + Y.
button or by pressing Ctrl + Y.
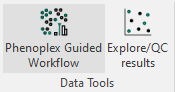
Phenoplex Guided Workflow
To access Phenoplex, make sure that your selected images have as associated Object info saved and at least one Multiplex variable output for the labels to phenotype on. If this is the case, you can click on the button in the Ribbon. If not please refer to the Object Info article.